Is there anyone over the age of fifty who doesn’t think back fondly on the “Back to the Future” trilogy, particularly the first movie? In the original, we were introduced to Marty McFly, played by Michael J. Fox, a high school kid in fictional Hill Valley, California in the mid 1980’s. During the movie, Marty travels back in a time machine situated inside a DeLorean sports car to the Hill Valley of the 1950’s and meets his parents as teenagers. He goes through a series of adventures and makes it back to the 1980’s while working hard not to change events from the past that would impact the world that he would return to.
 Always thinking about economic cycles, we note that the movie was released in 1985 but was conceived in 1980, right around the time inflation was peaking at 15%. By the time of the movie’s release, measured inflation had been brought down substantially and was well on its path towards the 1-2% range it has been in for the past decade. Few knew it at the time, but inflation’s back had been broken and would trend lower until today, nearly forty years later.
If Marty McFly had traveled back to the late 1960’s instead of the 1950’s, his adventure would have probably included references to iconic sixties happenings like the Vietnam War and civil rights protests. We would observe that he would have gotten to a period that was somewhat like today in equity markets. From the early 1950’s through 1973 the S&P 500 Index returned 7.9% per year on average. Not far off the incredible 9.1% per year during the current bull market that began when “Back to the Future” was being filmed. During the late stages of that glorious bull market, things got frothy, like some think things are getting today, especially with a group of stocks known as the “Nifty Fifty.” These were the most popular and best performing fifty or so companies that were regarded as “can’t lose” blue chips. “One decision stocks,” some called them, because all you had to do was buy and hold them. They were similar to the “FAANGS” of today (acronym for Facebook, Amazon, Apple, Netflix, and Google) although a broader group.
Worrying About Inflation
If Marty were just a few years older than his movie character and started working on Wall Street when the movie began filming, say in 1980, he would have seen a very different history. From 1973 through when inflation peaked, the S&P 500 was essentially flat and the “Nifty Fifty” underperformed the broader market. What characterized this period? Inflation, the very phenomenon that everyone seems to be worried about today.
Although there are similarities in recent market performance, the economic situation is very different today than it was in the early 1970’s. The most striking difference of course is the amount of leverage. It is everywhere: governments, corporations and individuals are all highly leveraged today compared to back then. We have discussed this many times in our publications so we will not belabor the point. Suffice it to say that because of that over indebtedness we think that policy makers will do everything in their power to suppress interest rates across the curve. Why? In our opinion, a substantially over-indebted economy simply cannot thrive with higher interest rates – especially not real (after inflation) interest rates. So, our research team’s opinion is that the long bull market in government bonds is intact and will continue to make new highs as interest rates make new lows.
Growth Stock Valuations and Interest Rates
Another reason that policy makers will do everything in their power to keep interest rates low is because of their fear of a stock market correction. Over the past two decades, smaller and smaller stock market corrections have elicited larger and quicker policy responses. It appears to us that there are few who are willing to stomach the consequences of a correction in stock prices. We do not subscribe to the view that many have about the stock market being too highly valued currently. Is it historically expensive on many metrics? Yes. However, its valuation makes sense given our view on interest rates. Valuing an equity is a very simple exercise. It is the value of the cash flow the company will earn over its lifetime discounted back to the present at the appropriate discount rate. The hard part is figuring out what those cash flows are likely to be and what discount rate to use to calculate the present value. But that is how the math works.
An easy thing to understand though is that it is assumed that an equity will have a perpetual cash flow (as opposed to a bond that has an end point to its interest payments). Another easy thing to understand is that the lower the discount rate used to calculate – or “discount” the present value, the higher the equity value. Importantly the relationship is not linear, it is exponential. As the discount rate goes down, the equity value goes up exponentially. At discount rates below 4% or so the exponential growth really starts to accelerate. This math is particularly pronounced for growth stocks. For these stocks, the market assumes their cash flows will grow strongly and consistently long into the future. This, we believe is the reason for the substantial market valuation that many believe could be over-valuation. Could the truth be as simple as this: the value of growth stocks, like the FAANGs, were driven up by a low discount rate?
The following chart is a hypothetical example of changes in a growth stock’s value at different discount rates versus a slower growth company. Each starts with $1 million of cash flow. The growth stock’s cash flow increases at 11% per year for ten years and then slows down to a more normal 4% per year perpetually. The slower growth company grows 4% per year the whole time.
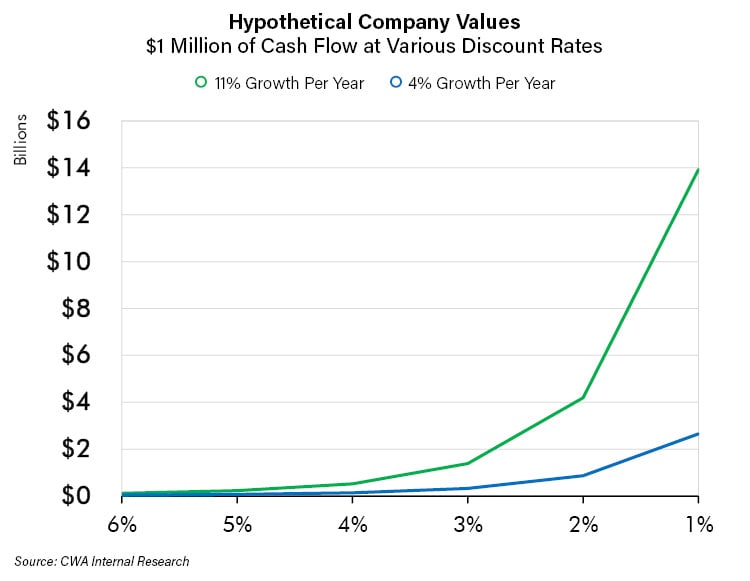
It is important to note that both companies’ values grow substantially as the discount rate falls from 4% to 2%. The growth company grows by 700% and the slower growth company by 500%. That is really a lot for both! However, the growth stock goes vertical when discount rates decline. Look at the chart, imagine if the discount rate were 1% where the growth stock’s valuation would be!
The problem of course is what happens when the discount rate goes up? In the example above, an increase of just 1% in the discount rate from 3% to 4% would drop the value of our hypothetical growth company by 67%. We estimate the current discount rate for stocks to be somewhere in the 3-4% range. The discount rate is the risk-free rate (which is the 30-year United States Treasury Bond interest rate) plus the equity risk premium, i.e., the premium above the risk-free rate that investors need to compensate for the riskiness of equities. If fears of inflation continue to rise and interest rates continue to rise too, policy makers know that the discount rate will rise, and equities will likely falter. Policy makers do not want that to happen, and we believe have the tools to impose their will, which is a reason why we believe that is not likely to happen. Central banks will “do whatever it takes” to prevent that scenario in our opinion.
Back to the Future
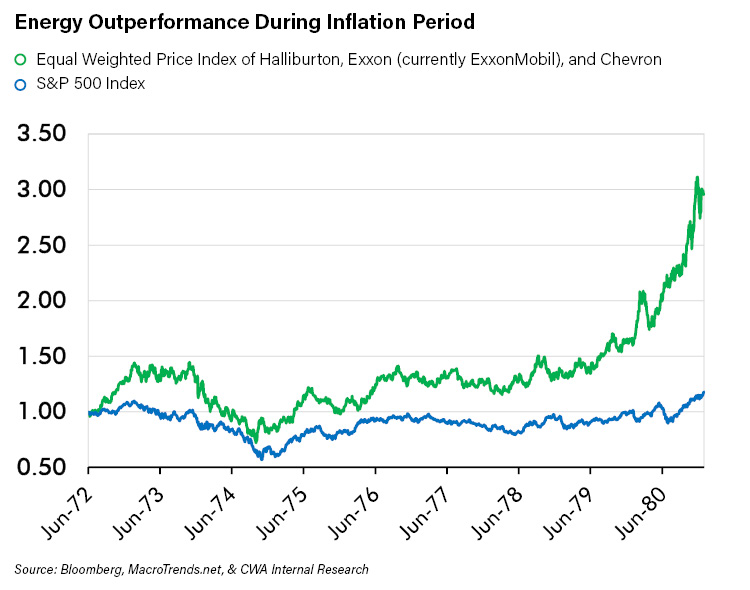
However, what if omnipotent central bankers or other policymakers are unable to create the outcome they seek? What if we are wrong and inflationary pressures mount, interest rates continue to rise, and equity markets falter? The answer, we believe, is to go back to the future. Interest rates and inflation picked up measurably in the 1970’s, especially starting in 1973. Stocks, especially the Nifty Fifty growth stocks, fell hard. However, that did not mean you could not make money in the stock market! If you were cognizant of the trend change towards higher inflation and invested accordingly, your performance could have been very good. In fact, during that period some commodity related stocks outperformed the highest flyers of today. The best performing S&P 500 stock of the 1970’s was an oil services company, Schlumberger. It compounded 37% per year from 1971 through 1980. The company benefitted from the prodigious cash flow available to its hydrocarbon producer customers from the high oil prices of that decade. Those companies spent their money relentlessly pursuing new oil fields around the world and paid Schlumberger handsomely to help them.
The decade was very good for investors in resource companies. Below is an index of three commodity related equities that we created compared to the S&P 500 during that period. As is evident from the chart, resource companies that benefitted from inflation did very well. So, we believe that certain equities can be a profitable investing solution to higher inflation, if it occurs.
Why is that? Given our explanation on discount rates above, should not a higher discount rate knock down the valuation of resource companies along with the rest of the market? The answer is no - if the increase in cash flows - especially the market’s expectation of future cash flows, increases fast enough to offset the higher discount rate. Earnings of resource companies can grow extremely quickly like they did in the 1970’s or like today where the earnings have been very depressed. The five largest oil producers have all had negative earnings over the past 12 months. Their cash flow, on average, declined 87% from peak to trough this cycle. Therefore, like back to the 1970’s, inflation should produce higher earnings that should raise the stock prices of resource companies. If this were to happen, the higher discount rate might, at the same time, be knocking down the value of growth stocks. That could be bad if you own “the market” but good for investors who understand the forces at work and own investments to profit from them.
Conclusion
The discussion above is important because it highlights why we think it is possible to be comfortable maintaining our base expectation of lower interest rates driven by the over-indebted world while also being able to position for the very real threat of inflation. With the prodigious increase in over-indebtedness, unprecedented money printing and ever-increasing fiscal stimulus schemes prompted by Covid-19, especially in the United States, the chronically murky crystal ball we look at has become even murkier. For our research team, this added uncertainty has, we believe, a very substantial silver lining. Our senior members started their careers and spent many years as resource and commodity specialists. So, we would welcome getting into a DeLorean and time travelling to somewhere with higher inflation. We think such an environment could be ideal for our skills, experience, and connections in the resource space. Furthermore, we believe that such a very different environment might reveal that passive index investing might not be all that it is advertised to be. Why? Because the index would likely be too heavily weighted towards last cycle’s winners and not enough towards this different new cycle’s winners. Therefore, our research team does not fear going back to an inflationary future!