Root Cause Analysis (RCA) is a methodology widely used in engineering, quality control, accident analysis and epidemiology. Although not familiar with the term until recently, it came up several times in my reading on epidemiology while trying to better understand Covid-19. RCA essentially is that in order to find a solution, one needs to look for the root cause of the problem. Its inventor was Sakichi Toyoda who lived from 1867 to 1930. He is known as the Japanese Thomas Edison. He outlined the steps to get to a root cause that he called “The Five Whys.” The concept was not widely adopted in the West until Edwards Demming, a well-known management consultant who studied Japanese quality control, brought it to American companies. It became a core concept in “Six Sigma” quality control programs.
The concept seems to be common sense. How can one expect to solve a problem if one does not know the root cause of it? This should be useful in a lot of the problems challenging our society today and certainly should illuminate portfolio construction. After all, surely it’s better to structure portfolios based on a deep understanding of the root cause of the challenges we face in the markets today.
In the past few weeks, the United States experienced the most widespread social unrest since the late 1960’s. We are also seeing the worst unemployment numbers ever recorded on some measures. So, what is the root cause of these problems? On the surface, you could easily answer “Racism” and “Covid-19.” But, perhaps, there may be a root cause to be discovered by deeper analysis?
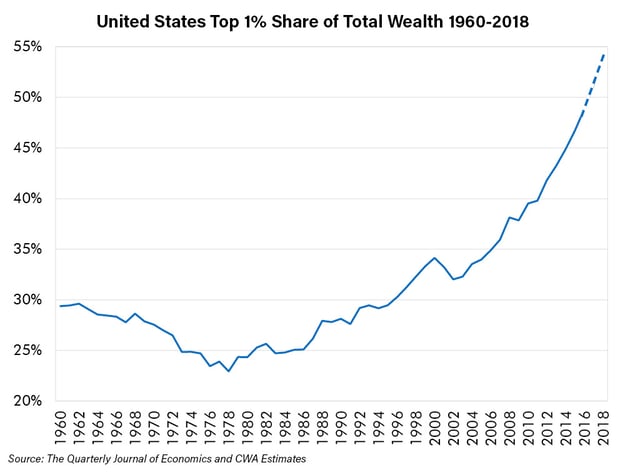
Many historians and economists have argued that all social and international conflicts have economics as their root cause. Karl Marx was one of them. He saw inequality in economic conditions and espoused the theory of communism which in one form or another is still being put forth today despite its abject failure everywhere it has been tried. In fact, his theories have gained newfound support as wealth disparity has skyrocketed all over the world, including here in the United States.
1971
We suggest that 1971 was a very important year. An event that year may be the root cause of many of today’s problems. What happened in 1971? The world went off the gold standard. Prior to then, foreign dollar reserves could be exchanged for gold at a fixed price of $35 per ounce of gold. So, the dollar was literally as good as gold. The dollar was in fact gold.
The world’s monetary system had been anchored to the dollar by the Bretton Woods System that the winners established following World War II. However, because the United States committed to continue redeeming dollars for gold, the system was really anchored by gold. This all changed in 1971 when Nixon “temporarily” suspended the conversion of dollars to gold due to an emergency situation (similar to how the Federal Reserve (Fed) “temporarily” expanded its balance sheet in 2008 due to the Lehman crisis). The emergency was that, after a decade of overspending on imports, Johnson’s “Great Society” social programs and the Vietnam War, accommodated by dollars created by the Fed, there were too many dollars relative to the gold supply. As inflation increased, foreign governments wanted to exchange their holdings of dollars for gold as they were allowed to by Bretton Woods. Nixon stopped this with the 1971 order.
President Richard Nixon, Treasury Secretary John Connally, Federal Reserve Chairman Arthur Burns & other Cabinet Members
Source: National Archives Catalog
With the dollar free to “float” its value it did what many floating currencies do: it sank. This currency devaluation exacerbated the domestic inflation problem and led to a decade of “malaise.” The dollar devalued against gold and other commodities (recall the 1973 Oil Crisis followed soon after). Those who understood what happened in 1971 were able to profit handsomely over the next decade if they positioned for inflation, which peaked at nearly 15% in early 1980. Inflation literally dominated the decade. If you understood it, that was a powerful insight.
Nixon removed the constraint on the Fed and the fiscal authorities. No longer did they have to act with prudence, constrained by the gold standard. Prior to this change, the Fed was limited in its actions by its gold supply. It could only lower interest rates and reserve requirements or expand its balance sheet if it had sufficient gold reserves. The suspension of convertibility changed all that. The Fed could pretty much do whatever it wanted. The only constraint would be the political pressure that might arise if the decisions created bad outcomes. The Fed could “do whatever it takes” to steal a quote from another seemingly unconstrained central banker, Mario Draghi of the European Central Bank.
Labor Suffers
The 1960’s were a time of social upheaval in America. However, many welcomed the changes that came from that upheaval. The Civil Rights movement promoted racial fairness in America. After several decades of improvement in economic conditions of the middle class, hopeful policy makers and citizens looked to the future and thought poverty could be eradicated and economic disparity could be alleviated further. Results would disappoint. Fundamentals deteriorated soon after the gold window closed. Our research team does not think that is a coincidence.
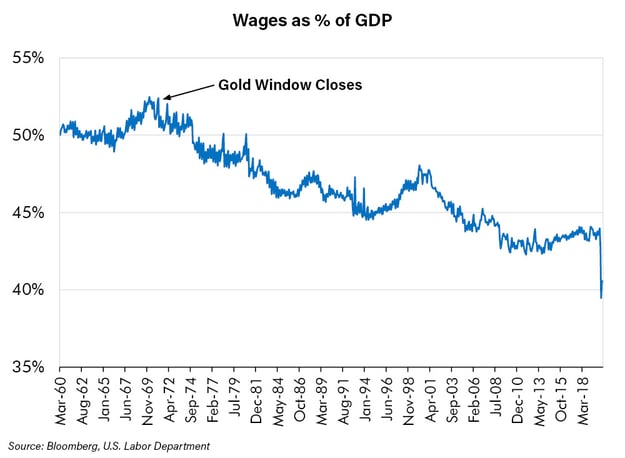
The chart above shows the wages and salary component of personal income as a percent of GDP. Note that it began a relentless decline right around the time the gold window was closed. This makes sense to our research team. Why? Because we believe the Fed has subsidized capital. Since 1971, the Fed has consistently lowered interest rates through many tools. If interest rates are lower, we believe this makes capital cheaper and is therefore a subsidy. This likely encourages companies to substitute capital for labor by using robotic machines for example or building new factories in countries with cheaper labor. This benefit to capital comes at a cost to labor and, we believe, results in the declining share of the economic pie shown above.
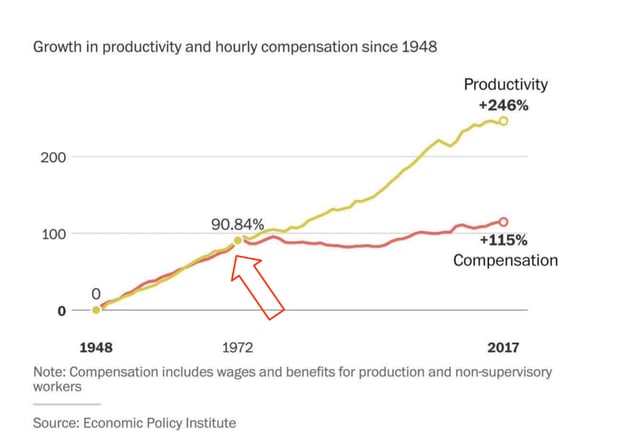
The subsidized capital helped productivity to rise and corporate profitability to grow. Of course, the gains of productivity growth were captured by shareholders and managers (whose compensation became more and more tied to share price performance) not by wage earners, as the next chart shows. We believe this led to the growth in inequality and today’s strikingly large gap relative to 1971.
Debt Growth and Financialization
We believe an unconstrained Fed has also led to repeated financial bailouts and seemingly unlimited debt growth.
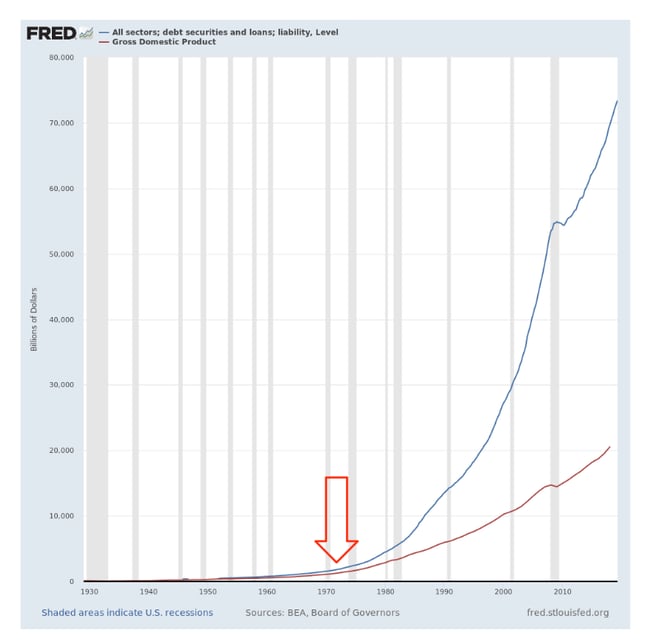
Since 1971, debts of all kinds, not just government debt, have grown much faster than GDP. Not only has the Fed subsidized capital to the detriment of labor but also it has a seemingly limitless ability to bail out profligate borrowers and their close cousins, stockholders. This started with the 1987 stock market crash and the Fed’s actions during the Savings and Loan Crisis a few years later. The Fed has demonstrated that it has the markets’ back, spending trillions to protect debt and equity markets from the worst consequences of their bad decisions. Back when policy makers used to struggle with this dilemma, they worried about “moral hazard.” You don’t hear a lot of talk about that anymore. Instead, we believe the Fed has rewarded risk taking with an ever faster and stronger “Fed put” under markets. Markets have benefited from this. But does this benefit have a cost? We think that the answer is yes. Many reasonable people now wonder if the Fed truly has no choice but to stay the course of low interest rates and money creation lest the financial markets suffer under the weight of this debt, dragging down the real economy with it.
How to Position Wealth
We have believed for some time, and written about this view often, that the Fed was unlikely to be able to unwind its balance sheet. Eventually, we thought, the Fed’s temporarily shrinking balance sheet would be replaced with a pressing need to reverse course and grow it further. This has now happened.
In our view that is likely to continue. We expect increasingly vigorous measures, such as negative interest rates, outright equity purchases, or other forms of financial repression and manipulation to follow. If so, we can expect many asset classes to do well. Some investments may do far better than they deserve, such as “zombie” companies – ones that would be dead but for Fed intervention. These zombies consume resources as they slouch along at a snail’s pace, slowing down the economy. However, low growth and lower interest rates can still benefit the highest quality companies, those with high returns on capital and sustainable and steady cash flows. It may well be that the valuations at which such special companies may trade could surprise people, should the trend in lower yields hold, as we expect it to. This same thinking could extend also to the highest quality, longest duration bonds and gold too.
Conclusion
Investors, if they hope to be successful, must try to understand the world and the most profitable way in which to address it. We have always believed that a deeper understanding drives better decisions. This may be especially true when, like now, events are happening rapidly. This framework has driven our understanding of the once controversial but now well-established lurch lower in interest rates. That framework leads us to conclude that this trend may not only continue but may also broaden to benefit a whole new class of securities, beyond the highest quality bonds and gold, to include the highest quality stocks as well. But, if so, do not confuse higher stock prices with a robustly growing economy. In fact, a deeper truth may be at work, slow growth may be the reason for strong high-quality stocks. Is that what is underway in the past few weeks in the market – at least for some stocks? We would not be surprised to see the real economy struggle. Growth may be slow at best and income inequality may not improve, not without major policy changes anyway. Our goal is to position our investments appropriately for the world we expect to see. We think it is prudent to consider the above as we think about the most effective way to position to capitalize upon such a seemingly counter-intuitive forecast. If we are right, we have our own root cause analysis that led us to the defining events of 1971 to thank.