A few days ago, while driving to work, I heard an interview on Bloomberg radio with Randall Kroszner, an economist from the University of Chicago. He was asked about the how the labor market was faring. He replied that he saw many positive signs. To paraphrase the dialogue, Dr. Kroszner stated that all the labor market data was strong. Unemployment was at or near the lowest ever, wages were growing at a healthy rate … everything was positive, even labor force participation was solid. That last bit surprised me. Was labor participation really solid?
Randall Kroszner is a well-known economist who was on the President’s Council of Economic Advisers from 2001 through 2003 as well as the Federal Reserve Board of Governors from 2006 until early 2009. Accordingly, from time to time he appears on financial television or radio. I am aware of who he is because he was one of my professors at the University of Chicago’s Graduate School of Business (now known as the Booth School of Business) when I was a student there in the mid-1990’s. Today, he is still there as a Deputy Dean and the Norman R. Bobins Professor of Economics. He specializes in banking and financial regulation.
I took Dr. Kroszner’s “Money and Banking” course in my second year at Chicago. It was a tough course where I really began to understand the way money is created through fractional reserve banking. This is a fancy way to say the process by which new money comes into being as a bank loans out deposits to a borrower. This borrower in turn deposits that money in a bank. That bank then lends most of that money out all over again. In this way, the bank actually creates “money” out of thin air by the act of granting the loan to the borrower! This enables the money supply to grow regardless of whether there is a gold standard, a central bank or a printing press. It is at the heart of our financial system and is what makes the financial system vulnerable in downturns when creditors all want their money back at the same time. For my current understanding, I owe a debt of gratitude to Dr. Kroszner.
So, naturally, when he is on the radio or television, I pay attention. Upon hearing him talk about labor force participation I recalled seeing the best-known data series on the subject not too long ago and thinking it suggested that the labor market was not as strong as the consensus view.
The Unemployment Rate
The most widely known and the bellwether data series watched by economists and financial professionals is the Labor Department’s Unemployment Rate, which currently stands at 3.5%, the lowest in over twenty years.
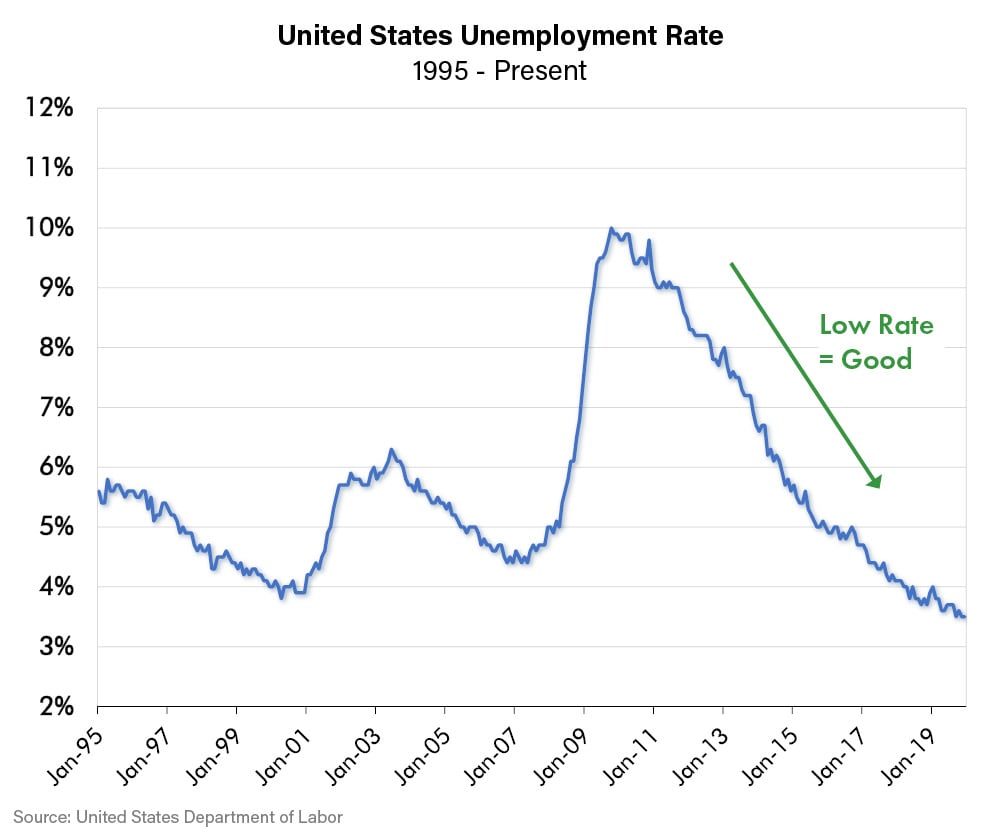
This rate measures the number of people with jobs divided by the total number of people in the labor force. However, the labor force is defined as people of working age who either have jobs or are actively seeking jobs. The number of total employed people is not difficult to measure, but it is complex to determine who of the rest of the working age population is actively seeking a job. This requires surveys, assumptions and statistical inferences. The exceedingly low unemployment rate is a product of using the number the Labor Department has come up with for the total labor force.
The Participation Rate
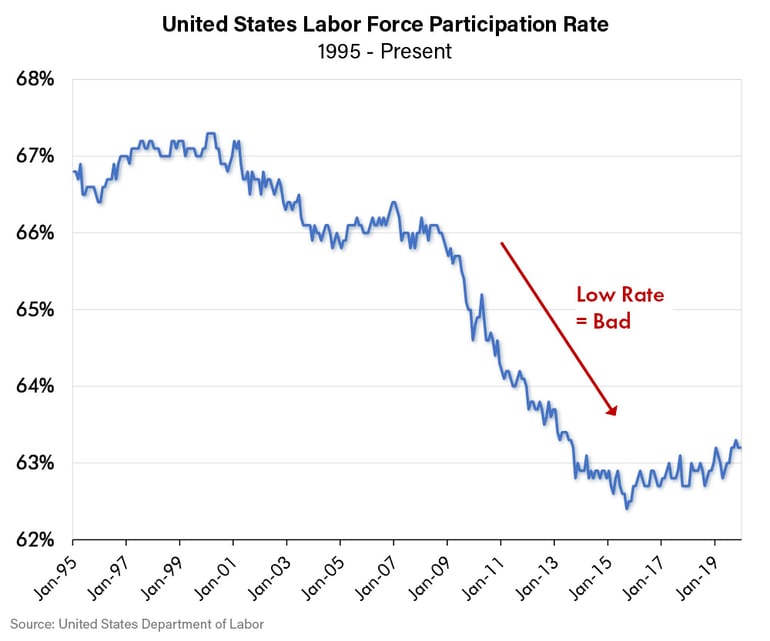
Perhaps Dr. Kroszner had another indicator that I am unfamiliar with in mind, but the participation rate is usually a reference to the Labor Department’s Labor Force Participation Rate. That Labor Participation Rate takes the total number of people who are working or looking for work from the Unemployment Rate calculation described above and divides by the total working age population (everyone 15-64 who is not in prison) to give another picture of the strength of the labor market. If that number is high it indicates a strong labor market … workers are either employed or in the labor force looking for work, as presumably, they have some confidence they can find a job. This participation rate currently stands at 63.2% which is exceptionally low historically as indicated by the chart below.
So, what was Dr. Kroszner saying? Perhaps I had the wrong data series he was referring to or perhaps he was referring to some other way of looking at the Participation Rate data? So, I took the Labor Department’s numbers and did a little simple algebra and came up with total unemployment as a percent of the total working age population. Maybe, this way of looking at the same data would show that since the unemployment rate was so low, total unemployment measured against the total population was also very low despite the low participation rate. The following is a chart of the results.
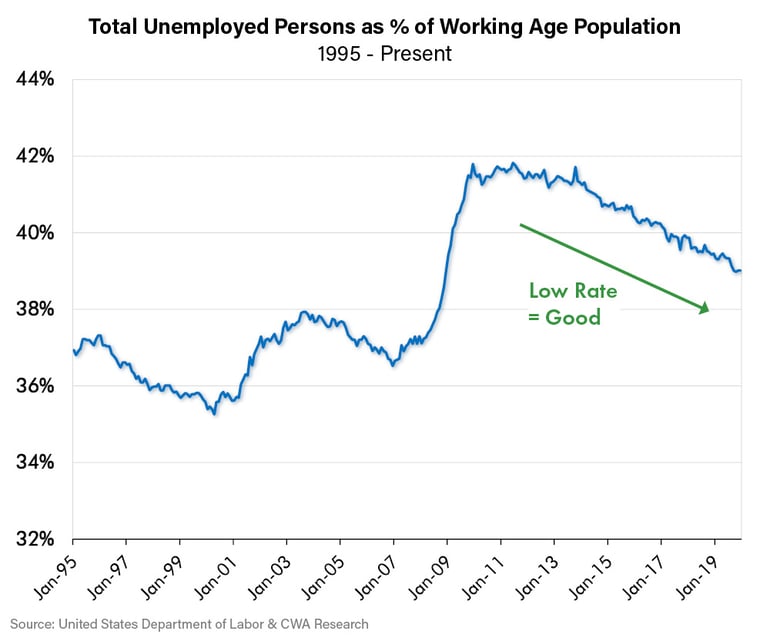
If this is what Dr. Kroszner was referring to, he has a point. The percentage of total unemployed persons has been declining rapidly from the persistent nearly 42% level following the financial crisis to 39% today. On the other hand, 39% is still historically high. It is a higher rate than existed at the peak of the early 2000’s recession and is only roughly half-way back to where it was prior to the 2008 crisis.
Labor Force Earnings
This exercise encouraged me to dig further into other Labor Department data. Some other data series do not look as great as Dr. Kroszner’s glowing description. For instance, the Average Weekly Earnings number has grown but at a far slower pace than Gross Domestic Product (GDP) growth. Since the financial crisis, Average Weekly Earnings have grown 0.5% annualized versus GDP growth that averaged 2.7%. This trend has changed a bit over the past two years but mostly because wage growth has stayed at nearly the same pace (0.7%) while economic growth has decelerated to 1.8%. Wage growth is still sharply lagging economic growth. This is an indication that the labor market is not as tight as some believe. An extremely tight labor market should drive up wages at a rapid rate as businesses need to outbid each other for this scarce human resource.
All this brings us back to a topic we have explored before: debt and how it matters. Perhaps the low labor force participation rate (and total employment number calculated above) is because some working age people have other sources of income? One such source could be government transfer payments. Transfer payments are government payments to individuals that are counted as part of income. Such payments include welfare, Social Security, Medicare, Medicaid and unemployment insurance among others. The data on transfer payments seems to bear this out. These payments have risen continuously for the past twenty years except for a blip after a large spike in unemployment insurance due to the Great Recession. Large transfer payments would naturally enable households to avoid needing employment or would enable them to grow spending despite slow weekly earnings growth. Obviously transfer payments are a form of government spending, and government spending growth has only been possible through debt growth.
Takeaway: Greater Uncertainty
Dr. Kroszner is a smart man. It’s possible that I misunderstood the “sound bites” in the interview described. My intention is not to suggest that he said anything factually inaccurate. Rather, the intent is merely to explore the strength of the labor market and the economy with the goal of explaining how we think about potential investment decisions.
Clearly, the labor market is much better than it was just a few years ago. However, it seems equally clear that it may not, after all, be the strongest in decades. The lowest unemployment rate in decades is only part of the picture; to be at full strength there would need to be higher labor force participation and stronger wage growth. To the extent that working age people are contributing to the economy, it seems they are being helped not just by low unemployment but by debt financed transfer payments. The key takeaway is that this economic cycle, albeit very long, has distortions that are unusual.
This lack of full strength of the labor market is just one such example. We have examined others in previous reports; such as, GDP growth from debt creation and a break from the typical cyclical pattern of declining government deficits late in the economic cycle. In Lewis Johnson’s “Trends and Tail Risks” a common theme has been the paradox of negative yielding debt. In all these unusual situations, we think the consistent theme is excessive debt. This debt may be distorting the typical patterns from the past century in the economy and financial markets. This creates uncertainty.
Conclusion
Dr. Kroszner’s Money and Banking course at the University of Chicago did not delve into security pricing. That was covered in other classes. Valuation theory teaches that the greater the uncertainty, the higher risk premium one needs to apply to the pricing of an asset. Simply, this means the greater the uncertainty, the lower the price. This concept is not only taught at Chicago, it’s taught at every business school around the world. In fact, one doesn’t need an MBA to understand it.
The less you know about something, the lower price you would pay for it (all else being equal). When shopping for a house for example, if you were told you couldn’t do an inspection, would you bid as highly and with as much confidence? Of course not. Today, on some valuation measures the U.S. equity market is priced at or above its highest level ever. What are the risks in such a high valuation? It should be no surprise that so much debt has created unusual distortions and greater uncertainty. The biggest surprise, perhaps, is that investors do not seem to be demanding a discount for the uncertainty all this debt creates. Therefore, it appears reasonable to seek out some protection in the form of natural hedges (such as uncorrelated investments in areas such as gold, higher quality bonds and other select counter cyclical investments) to diversify and strengthen our portfolios against the uncertainty and high valuations we see.