“Prediction is hard. Especially about the future.” – Dr. Nils Bohr, the Father of Quantum Physics
Investing is not easy and sometimes its thankless, even when you are correct. Last month we wrote about our long time bullish view on gold. We’ve had that view consistently since the demise of the dot.com bubble two decades ago. It's hard to argue with that investment insight. Gold has trounced most asset classes, including the S&P 500. Gold purchased on January 1, 2002 has appreciated 456% versus the S&P 500’s 281%. Nevertheless, my own wife thinks I’m a lousy investor for not putting our money in the stock market. I think, what she really means is that I’m a lousy investor for not putting all our money in the FAANGs (Facebook, Amazon, Apple, Netflix, Google), a group of stocks that have accounted for the lion’s share of the S&P 500 gains. After all, had I been “smart” enough to invest in Apple instead of gold we’d be up 43,988% since early 2001.
Seeing the future is not easy. Even Apple would have started out underperforming gold for the first three years (2001-2003) of that investment. You’d have been up 56% owning gold and 25% owning Apple. Certainly my wife would not have been happy with the Apple stock choice during the holidays in 2003.
The reason to bring this up is because, as is typical when the market makes major moves in one direction or another we have to wrestle with sometimes valid criticism about the winners we have missed and laggards we are holding on to. That is understandable. Hindsight in investing is truly 20/20. It’s human nature to extrapolate present trends into the future. That is part of our psychological make up. Our hunter gatherer ancestors figured out how to survive by learning how to follow patterns of prey behavior. Early farmers were successful because they knew the seasonal cycles of the weather. Those who acted contrary to foreseeable trends usually ended up hungry and then dead.
On the other hand, humans probably wouldn’t have been such a successful species had there not have been individuals willing to reject established patterns and think outside the box. There was probably the maverick caveman or cavewoman who risked missing out on a few hunts to stay back and perfect the new bow and arrow that he or she invented. That caveperson’s spouse was probably pretty scared the family would go hungry while their nerdy inventor spouse tinkered with the new tool while all the other tribesmen went out to hunt. “Why can’t you be like the other cavemen?” the other spouse might have nagged.
Maybe that family did suffer some nights without a meal. However, they ate pretty well after the new weapon was perfected and was used to make hunting far more efficient. Many similar scenarios likely played out in early human history and thus, like trend following, humans also developed the worthy skill of looking at things with a fresh perspective and an eye towards how things might change.
Fast forward to today and investors who are hunting for stocks and trying to gather wealth need to be open to more than just trend following. Good or bad price performance may often be indicative of a trend that will continue, but often it may not. So, investors who are drawn to sell their losers simply because they have had substantial bad news and are losers should resist that temptation. Those companies would not be losers if there had not been bad news. The question is whether that bad news is amply reflected in the current price and what are the prospects for the future. The past loss is a sunk cost. Sunk costs, except for tax savings purposes need to be ignored. Investors who always sell their worst performers and add to their best performers may very well, under many circumstances, end up with sub-optimal results.
This is especially true in periods of transition like we think may be coming soon. After all, the outperformance of growth stocks, led by the technology sector has been unprecedented, even taking into account the late 1990’s tech bubble. Below is a chart borrowed from our friend John Roque at Wolfe Research that shows adjusted for 2018’s S&P 500 sector changes between Technology and Communications, the Tech sector has far exceeded its 2000 peak in terms of its size relative to the rest of the index.
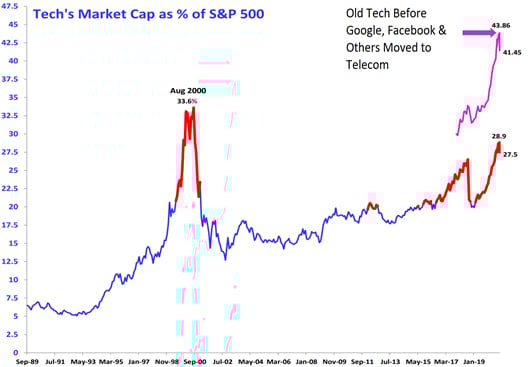
Source: John Roque - Wolfe Research
In our opinion, its unwise for investors to expect that this may last for very much longer. In the transition period after the last peak of this trend in 1999, the trend followers were roughed up badly. Below is a table of the top 10 best and worst performers in the S&P 500 Index in the year prior to March 31, 2000, roughly when the trend changed. The column on the far right shows each of those stocks subsequent two year performance. In the case of the top performers, every single one underperformed the market over the following two years and by an average of 67%. Ouch! The managers who had their clients loaded with those top performers went from heroes to goats quickly. Quite the opposite occurred with the worst performers. Those who bailed on all of those losers missed the outperformance of eight of the ten. Those eight outperformed by an average of 92%. Who says the trend is your friend? Not us! At least, not always, especially at extremes in valuation.
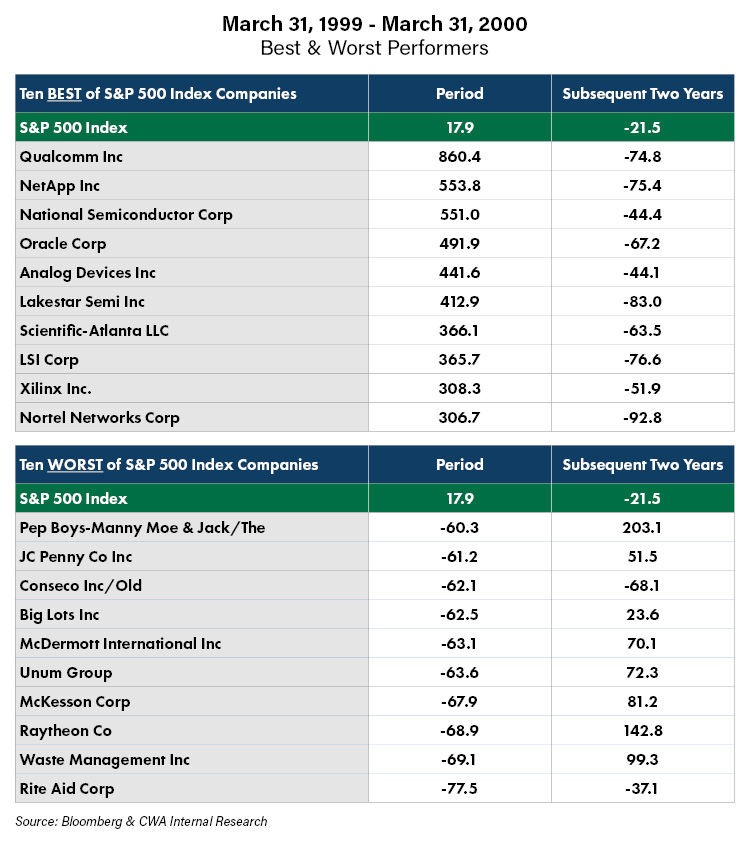
Of course, one might argue that we cherry picked the data from a period that saw a transition from a bull market to a bear market. That criticism is somewhat valid because, as mentioned, following trends during periods of change is obviously not going to work. The point is that no one knows for sure when a trend will change so following it is often not a path to success.
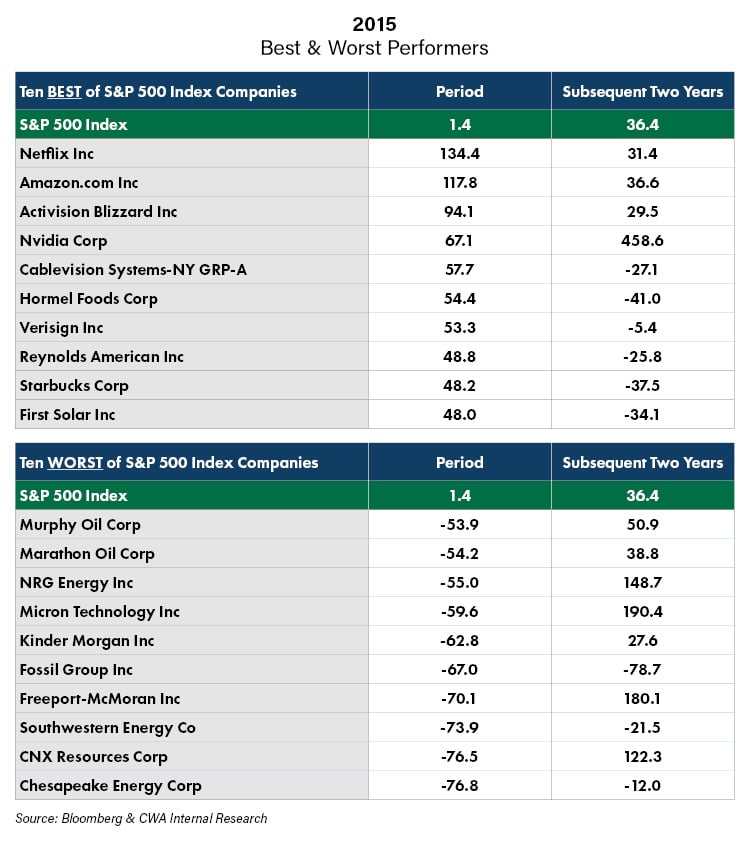
However, we can illustrate the point in periods of less dramatic transition of the over all stock market performance. Below is a table of the ten best and worst performing stocks in the S&P 500 in 2015. Again, we look at the subsequent two year performance of those stocks. Unlike the prior period, the whole period was during a bull market although 2015 was a weak year of only 1.4% S&P appreciation and the subsequent two years showed much stronger growth averaging approximately 18% per year. During this period six of the ten top performers underperformed the following two years with five of those six underperforming by 20% or more. Of the worst performers, six outperformed by an average of 28% each.
We examined many other periods during the past twenty years and found that in most instances including strings of three strong years for the stock market at least three or four of the ten best performers underperformed the following two years and the results were similar for the ten worst performers outperforming.
Conclusion
The point of all this is that one should not look back but rather look forward. A particular trend, either good or bad often has important information content about the future. Consistent multi-year growth or decline for a company is an important factor in considering what is likely in the future. So is consistency of returns. However, that consistency must be evaluated. What factors are driving the consistency? Are those factors sustainable given the size of the over-all market, the phase of the economic cycle, the cost of inputs or other factors? Is the consistency being driven by creative accounting that may be unsustainable? Is there a competitive product that is about to disrupt that consistency? It is only after asking and answering a lot of questions that one should determine whether a trend is likely to continue or not. The current price of the stock is relevant to the investment analysis but only to determine valuation. Whether it got to that price by recently going up or down should not be of much importance to the analysis. So, to our research team the conclusion is clear: don’t own the winners just because they have been winning and sell the losers just because they are losing. Watch the trends and think outside of them.