Stamford Connecticut based Columbus Circle Investors was a very successful money manager in the 1990’s. Its small cap fund had a particularly good run during that decade. It was run by a man named Don Chibocous who was one of the firm’s founders. He hired me for my first job in the industry right out of the University of Chicago Graduate School of Business, now known as Booth. I do not recall much about my interviews with Columbus Circle other than one interaction that stood out and is embedded in my memory to this day. Mr. Chibocous asked me the following question: “if you turn out to be really good at picking stocks and become a star in the industry, what percentage of your picks do you think will be correct?” Obviously, I knew the answer he was looking for was a lot lower than a typical person would guess. Having the optimism (and perhaps arrogance) of youth my thought was I could be right 75% or more of the time. However, I knew he was looking for a more unpretentious answer so I picked 65%. He replied, “If you can do that in your first couple years you’ll own this place. If you are really good you’ll be right 55% of the time.”
Well, that was sobering, but somewhat encouraging too. If one just flipped a coin they would be right 50% of the time, wouldn’t they? Certainly I could exceed that by 5%. Wow, I was going to have a bright career! It’s hard to say how the real percentage turned out some 25 years later. Being “right” on investment picks can be defined many different ways. It’s all about growing the capital under your direction over the time period it’s invested. However, there are a lot of nuances to that. Are you “right” when your capital outperforms a benchmark (such as the S&P 500) but loses in absolute terms? Most would agree that if you are managing equities and you lose only 5% when the S&P 500 declines 20% you were “right” in your investment choices. Of course, there are those who would not agree. Some expect good investors to always make money!
Further, you could be right for all the wrong reasons and then you were in fact wrong but got lucky. I recall a meeting in 2002 with the chief economist of one of New York’s premier investment banks. He has since moved on to become the president of one of the major multi-lateral international financial institutions. At the meeting, he was very convinced that the United States was going to invade Iraq and rid that country of Saddam Hussein. That would help to end the recession we were in at the time because, among other reasons, oil prices would decline unleashing a host of positives upon the world economy and therefore he urged that investors should enthusiastically embrace the equity market that was in the midst of a bear market. As it turned out I recall, none of his predictions that day ended up being correct (other than the Iraq invasion), particularly the decline in oil prices, but, nevertheless, the recession ended and the stock market entered a new bull market. Due to being right but for the wrong reasons, he returned the following year to gloat that he had been “right” on his stock market prediction.
Natural Gas Example
Predicting the future is hard, really hard. Making money off of correctly predicting the future is pretty hard too. Often, even when you correctly predict the future, you can fail to capitalize with the right, well-timed investments. Our recent experience with natural gas illustrates this difficulty. In April of 2019, this publication released a piece entitled Natural Gas Investing Lessons from Dr. Suess. In it, we argued that natural gas was likely to appreciate in price, although we were uncertain on the timing. We were correct. In fact, just a few months ago, in May of this year we published a second piece entitled More Natural Gas Investing Lessons from Dr. Suess, in which we predicted that prices would imminently begin the climb we had predicted a few years earlier. We were right again.
Natural gas is a highly seasonal commodity with heating demand driving prices in the winter. For that reason we look at natural gas prices on a twelve month average basis, what is known in the industry as the 12 month strip. Since April 2019, the 12 month strip has appreciated 75%. Quite a call if we don’t say so ourselves! One would think since we got the commodity right we easily made money in the natural gas stocks we invested in. In fact, we had some trouble in that regard, at least until this past week. Below is a chart of an index we created of the price performance of the unweighted average of the seven largest capitalization exploration and production companies with greater than 70% natural gas production and reserves. Also included is the relative performance of that index against the S&P 500 and the 12 month natural gas strip.
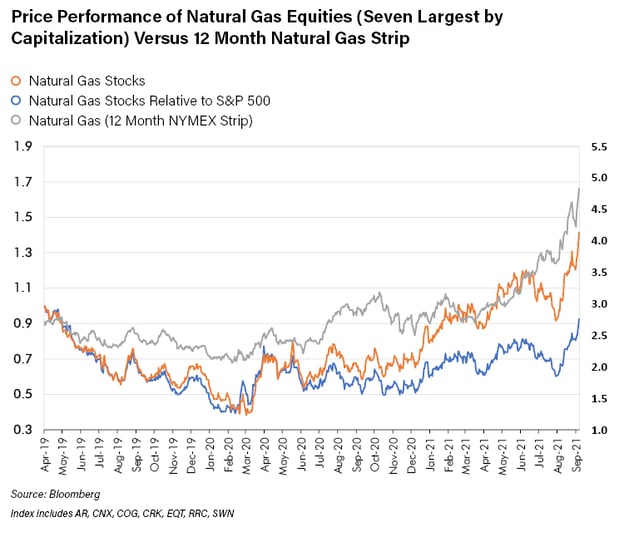
Natural gas equities performed well over the period but have lagged both the S&P 500 and the commodity they produce. In fact, as the commodity has skyrocketed, the stocks have been muted, at least up to a few weeks ago. Hopefully that is now changing. So, as one can see, a “right” decision on the commodity did not translate to outperforming stocks. Why might that be? Commodity companies usually have leverage over their commodity. By that we mean their margins and thus earnings improve disproportionally to revenue. That is because there generally are no extra costs associated with higher price realization. Every additional dollar flows directly to earnings. Of course, if earnings accelerate, even dramatically, there is no law that requires stock prices to go up also. Sometimes as earnings go up multiples compress. Also, many market observers tend to believe that equities are forward looking, that is, they anticipate change. Under that thesis, equities would move prior to commodity price changes, not after. In our experience that does occur, but only sometimes. This period has not been one of them.
Multiple Compression
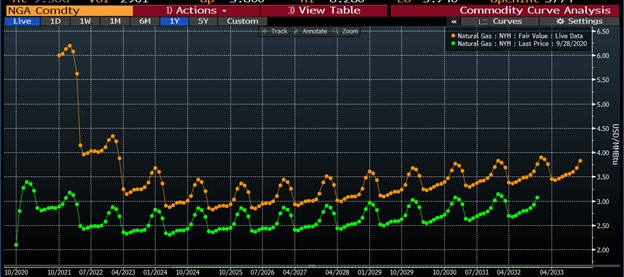
As to stocks not moving with higher earnings, that occurs when multiples compress. The multiple investors are willing to pay on near term earnings can vary for a wide variety of reasons. In the case of natural gas producers, we think the multiple compression over the past few years has been a result of the growing conviction that the energy transition away from carbon-based fuels was gaining momentum and would happen faster than what was reflected in equity valuations. Remember, a stock price is the discounted value of expected future cash flows. The faster the adoption of new forms of energy takes place, the lower the future cash flows for gas producers. Investor perceptions on this may be reflected in the natural gas futures curve. The futures curve shows the price of each futures contract in graphical form. As shown in the chart below, despite the high near-term price, the market expects low gas prices for the ten years starting in 2023.

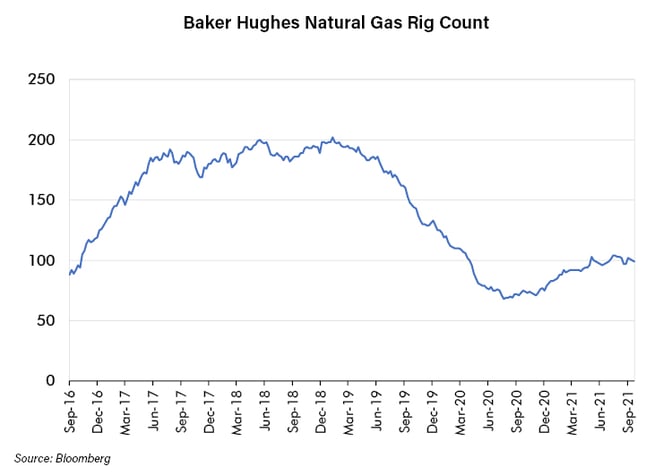
It is our view that this chart shows the perceived lack of demand in the future since, in our view, it is unlikely that gas supply will grow dramatically since even the current massive price move higher has not moved the natural gas rig count much at all (see the chart below). The investment community appears to simply not want to fund investment in natural gas (and other hydrocarbons) given the pressures of decarbonization.
Importantly, the futures curve also indicates another reason natural gas stocks have not risen as much as we expected. On the chart above we include both the current curve and the curve six months ago. Note that near term prices have moved dramatically while further out prices have not moved too much at all. The current price is up to $6 per mcf from roughly $2.80 one year ago, a change of $3.20. Most prices beyond 2024 appear to have risen only about $1. As noted above, a company’s value is determined by expectations of its future cash flow and the future cash flows of natural gas stocks have risen, but not by nearly as much as the near term gas price change would indicate.
Unique Company Risk
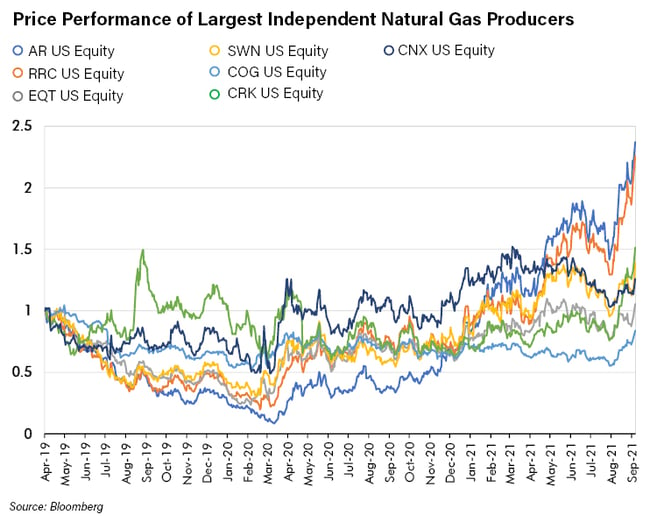
Finally, it’s important to note that one can be right on a macro move such as predicting that natural gas will enter a bull market and also be correct that producer equities will rise but still not get your investment right! Just because we decided to make a timely investment in natural gas equities, does not mean we picked the right ones. The chart below shows the performance since April 2019 of the seven natural gas stocks the make up the index we created in the first chart in this report. It is evident that performance varies widely for company specific reasons. Some companies are more defensive and some more aggressive, which may determine how their stock performs in an upcycle. Additionally, new management decisions or initiatives can change perceived value, sometimes dramatically. For example, during this period, one of the natural gas producers surprised the market by merging with an oil producing competitor at what some thought was too high a valuation. Investors sold the stock on that news, therefore inhibiting that company’s performance relative to its peers.
Conclusion
Given how difficult getting it right is, what is an investor to do? Of course, we should work relentlessly to uncover good investments and of course we should study as vigorously as possible to understand all the factors that might impact each investment. Nonetheless, no matter how good we are, many of those investments will not work the way we expect. There is only one solution to that. It is diversification. As Don Chiboucas told me in my Columbus Circle interview, a good investor might get 45% of their investments wrong. With diversification and some good fortune, the 55% that are right will offset the bad choices and lead to a portfolio that gets it right, which is the ultimate goal. It is that simple. Well, that and a whole lot of humility. Investing is hard.