CHIEF CONCLUSION
It should come as no surprise to our long-term readers that, when equity valuations become extended in our view, our research team grows more cautious. Our team finds itself at such a juncture today, as we note our belief that the information technology sector is trading at historically high valuations. Can they move higher? Of course they can. But on many measures the market – as we outline below – is partying like it’s 1999. We remember that period well and are thankful to note that we continue to find value in this market, only in different places from where many others are looking. Diversification now, our team believes, is more important than ever.
“So tonight I’m gonna party like it’s 1999.” – Prince
I suppose the curse of being in the business of investing for more than twenty years, is that there are memories you cannot forget – things that you have seen that you cannot un-see. For me, one of the most unforgettable experiences was the Tech Bubble that rallied relentlessly into its peak in 2000. On many of the valuation metrics that we favor that period qualified as a mania. After the collapse in 2000, many of us who counted ourselves in the tribe of value investors were convinced we would never again see such valuations in our lifetime. But we were wrong.
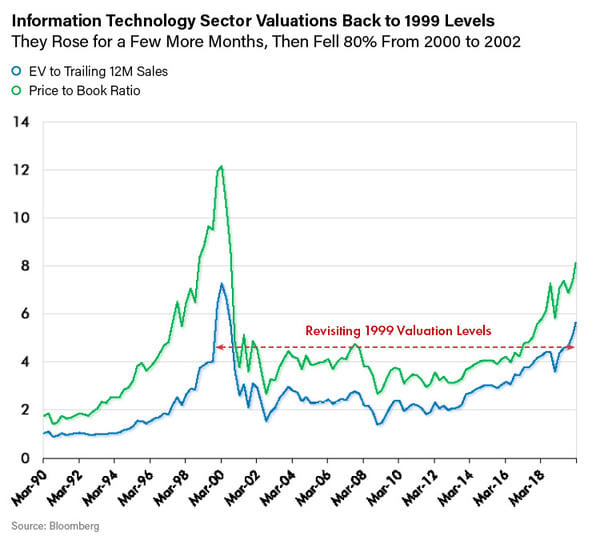
Today’s markets are back to those levels again, as a fresh crop of investors, twenty-one years later, are partying like it’s 1999 when it comes to the “Information Technology” sector of the S&P 500, as the chart below shows.

As valuations have expanded, this sector has outperformed. What a powerful and useful trend this has been to date for those invested in the stocks in this sector. Why? Expanding valuations tend to be the lifeblood of secular bull markets because investors can profit not just from rising earnings but from rising valuations as well. At a particular multiple, a stock can go up as fundamental improvement takes place. However, a stock price can also go up through the rising valuation investors are willing to pay for those fundamentals. Below we demonstrate how this works.
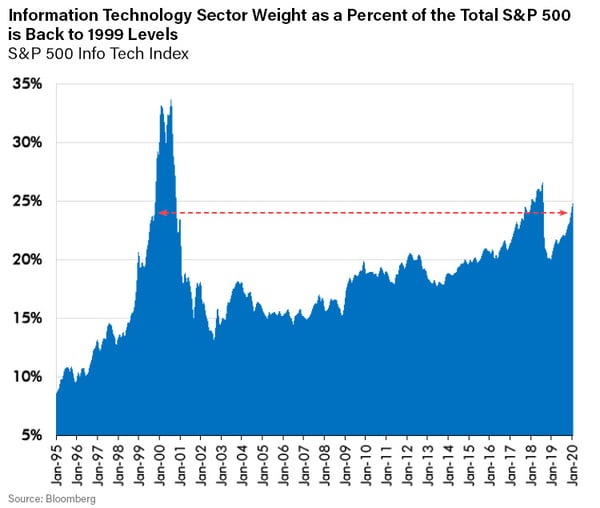
The chart below illustrates the S&P 500 “Information Technology” sector. This sector now accounts for 24.7% of the S&P 500, a level last hit in 1999. In fact, it shot as high as 33% in 2000 – all in one quarter I might add - but, if you didn’t sell with pin-point accuracy, it was a long and painful ride down into the depths of 2002.

The point in the two charts above is that investors are now paying almost three times as much for the same fundamentals in this sector as they did in 2012. Investors in this sector have thus likely benefited from these twin tailwinds of improving fundamentals and rising valuations that have reinforced each other in a powerful way. Make no mistake, this can be the stuff of powerful bull markets. But can valuations expand forever? What happens should valuations reverse from rising to falling?
In our investing experience there is almost always a catch. Our research team believes that the catch now may be the rising probability that today’s historically extended valuations could work to lower future returns. In our experience, it is possible to overpay for even the best of businesses. Just ask anyone who bought their dream condo in Florida during the white-hot housing boom of 2006 and is still underwater on their investment today. That’s the problem with valuation, it’s a powerful tailwind when it’s expanding, but when it’s contracting, it can be a debilitating headwind.
“All I want to know is where I am going to die, so I will never go there.” – Charlie Munger
A natural question that everyone wants to answer is when will the market peak so I can sell. Wouldn’t that be nice to know? Value investors like us have concluded that no one can truly see the future with perfectly clear vision. This answer eludes us as it does everyone else.
So, if foretelling the future is too high a hurdle, what is the reasonable investor to do when trying to manage through historically high market valuations? Well, to us it means looking for bargains in areas that are overlooked by those too busy chasing today’s winners rather than seeking out those of tomorrow. Thankfully, among the investments that we attempt to make to diversify our exposure in an historically expensive market, we have found, and are invested in, one such a sector. This sector is not only cheap by historical standards but has also, thankfully, demonstrated in past periods of falling market valuations a welcome diversification effect. That sector is precious metals, and we view what is going on in that sector today as interesting. We believe one of the best ways for investors to see this for themselves, is to examine the ratio of the Dow Jones Industrial Average to the gold price, the Dow/Gold ratio.
Pierre Lassonde, the Chairman of Gold Royalty Company Franco Nevada, on the Dow/Gold Ratio
Below is a YouTube clip of Pierre Lassonde describing how he thinks about the Dow/Gold ratio. Pierre, in my opinion, is one of the most astute observers of the gold market I have ever met – and I have met a lot of good ones. I suggest it’s worth three minutes of your time to watch the video clip below where he walks through his thinking on the Dow/Gold ratio. His point is that there are long periods of time when investors may most profitably own financial assets, and other times when hard assets such as gold, are wise to own.
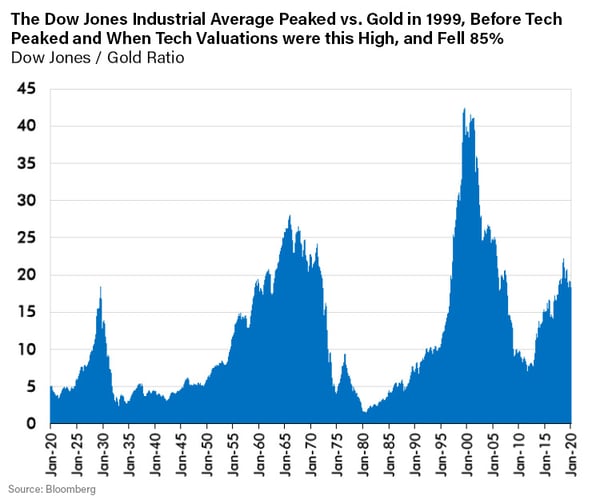
Perhaps one of the most interesting aspects of today’s markets is not that the information technology sector is fully valued on an historic basis, but that, despite this, gold has been quietly outperforming the Dow Jones Industrial Average for the last sixteen months. The chart below shows that gold has outperformed the Dow since October of 2018. That seems like a long time to me, especially where riskier assets such as technology are also outperforming.
It also shows that gold’s outperformance in the waning days of the Tech Bubble began when the Tech sector’s valuations were at today’s levels. I find that fascinating and wonder if today’s gold sector investors may benefit as they did during the waning days of the Tech-driven cycle that peaked in 2000. Certainly, it’s my belief that gold’s best diversification benefits come through when the valuation of financial assets is at historical highs, such as today.

When you step back and view this ratio over an even longer period, in this instance from 1920 to the present, you do indeed find long and powerful periods where leadership in the market changes hands from financial assets to hard assets such as gold, and back again. I find it remarkable, and frankly a bit worrisome, that this Dow/Gold ratio is back to where it peaked in 1929!
How is it that the Dow Jones Industrial Average, the junior tranche of American civilization, primed to benefit from all our collective striving and innovating in the world’s most dynamic economy, has made no cumulative headway versus gold in more than ninety years? This is astounding! Maybe one day, someone smart will explain this to me. But what does seem apparent, is that there may be long periods in time when investor’s ownership of precious metals and their related equities can be rewarding. It’s my firm belief that, historically, gold’s best diversification benefits come when the valuation of financial assets are extended on many measures, as they are now. This is the key factor behind our research team’s desire to participate in the precious metals sector now, given historically high valuations such as those in the leading Tech sector.
“Diversification is an established tenet of conservative investment.” – Ben Graham, the Father of Value Investing
In Conclusion
Of course, there are many ways by which our research team can try to promote better diversification among our investments. Precious metals are only one such example. But when industry experts that I respect, such as Pierre Lassonde with more than forty years’ experience, are enthusiastic about precious metals, I am going to listen!
Now let me reiterate that, sadly, our research team too must face an uncertain future without perfect knowledge. As value investors, our goal is to let valuation be our guide, minimizing our investments in sectors when valuations are high, and more actively participating in sectors where the valuations are lower and investments there are more out of favor. Many valuations in the all-powerful tech sector are very high indeed right now on an historical basis. So, don’t be surprised if our team’s enthusiasm wanes on the sector before that of other, less experienced and less cautious investors. Others may have forgotten the past, but we have not. We cannot unlearn the lessons of the epic crash that haunted investors who partied in 1999 - the last time tech valuations were at current levels. I can remember how that ended, even if those that are now partying like it’s 1999, do not.
Our team’s belief is that disciplined risk management is the best way to invest in the long run. Along the way to the long run, there can be many short runs in which the different mix of investments that we favor may have a very different pattern of returns from that of “the market.” But make no mistake, it’s not a bug, it’s a feature of how we aspire to invest. During most of these times, valuation is our team’s most favored risk management tool. During such times our team is not shy about seeking out and patiently owning what it thinks may be the world’s most compelling investments, even if this means that our investments look nothing like “the market.”
