Recency and trend bias are related concepts that suggest people give greater weight to recent events than older ones and therefore think current trends are likely to continue. These concepts are used extensively in the field of behavioral finance which tries to explain investment decisions and asset pricing through the interplay of psychology and emotion with traditional valuation and economic factors. These biases suggest that investors expect recent performance is likely to continue even in situations where there is no reason for that to be true. Early in my career I worked for a well-known mutual fund company that was harmed by these biases.
The firm’s growth strategy was to buy other funds with exceptional three-year track records thinking their powerful marketing department could grow the funds by appealing to the many investors who looked at recent track records when deciding where to invest. Of course, those funds were very expensive to buy because the marketplace valued them highly precisely because of their recent track records. So the firm spent a lot of money on acquiring funds. That money ended up being wasted because most of the new funds quickly reverted to average performance which prevented them from growing in line with the optimistic forecasts the company had for them. That result might not have been surprising if someone had looked at the many academic studies that have shown that great performance is far more likely to result in reversion to average performance than continue.
As this example shows, recency and trend bias are very important to consider. One could even argue that the 2008 financial crisis was a result of them. One of the primary causes of the crisis was the collapse in the price of residential mortgage-backed securities. Their value was derived from models of home price that did not consider the possibility of a decline in home prices nationwide. The models were built that way because the data subsequent to the Great Depression had shown that to be true. Data from before the Great Depression that would have included the possibility of negative price moves in home values was ignored. One might not think of a 60-year trend as recent but that situation illustrates an important point about trend bias: the longer a trend continues, the stronger the bias in thinking it will continue seems to become.
That fact seems understandable from a socio-psychological perspective. The longer a trend has been in place, the fewer people there are who experienced a different reality. History books and data series are much more difficult to ignore if your neighbor with personal experience tells you about it. There are not many Americans alive today and certainly none who were active professionally when the market peaked in 1929. Personal experience of being a stock investor at that time, when the major index did not make a new high for 25 years, is non-existent. Most experienced investors, myself included, did suffer through the 13-year new high drought that started in 2000 and ended in 2013 (with a very brief new high made in 2007 just before the 2008 financial crisis commenced). However, since then half a year has been the longest anyone has waited for a new high in the major U.S. indices to be made. Recency bias would suggest that many investors are expecting this trend to continue. Anecdotal evidence supports this contention. There seems to be no shortage of research reports, newsletters, and interviews predicting that the market will continue to make new highs. It might.
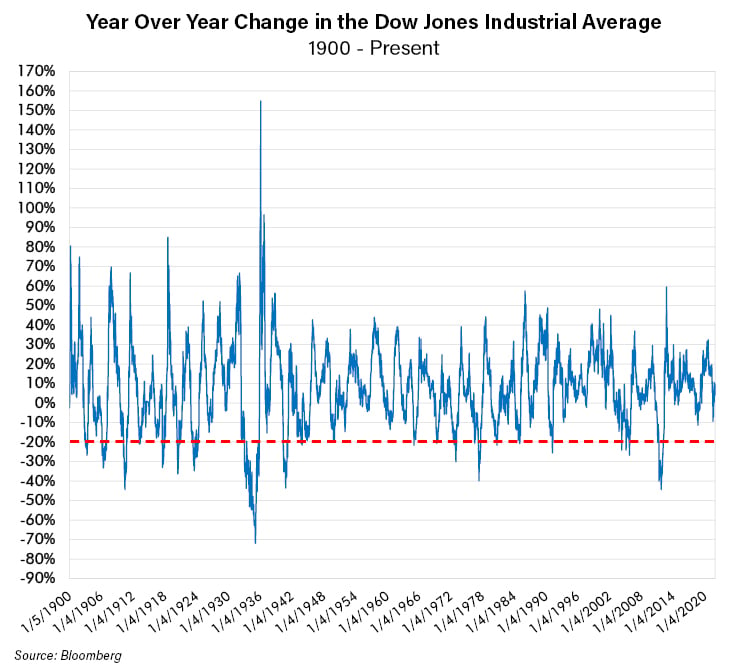
However, putting recency and trend bias aside and looking at just market performance over time easily illustrates the truth that the market tends to perform poorly sometimes. The following chart shows the year-over-year performance of the Dow Jones Industrial Average since 1900. A 20% year-over-year decline has not been particularly rare although certainly less frequent in the past 30 years.
Trend and Recency Bias Reversed
Recency and trend bias coupled with valuation analysis helps explain why these downcycles occur. When recent economic, company and stock price performance trends are good, investors expect them to continue. This drives stock prices higher. However, at a certain price valuation becomes too high, even for the best company with the best trend. We explained this in a prior Risk On / Risk Off titled “Great Companies, Bad Prices”. So, because of these biases alone, it is reasonable to expect that after a strong period in the stock market, a correction may occur.
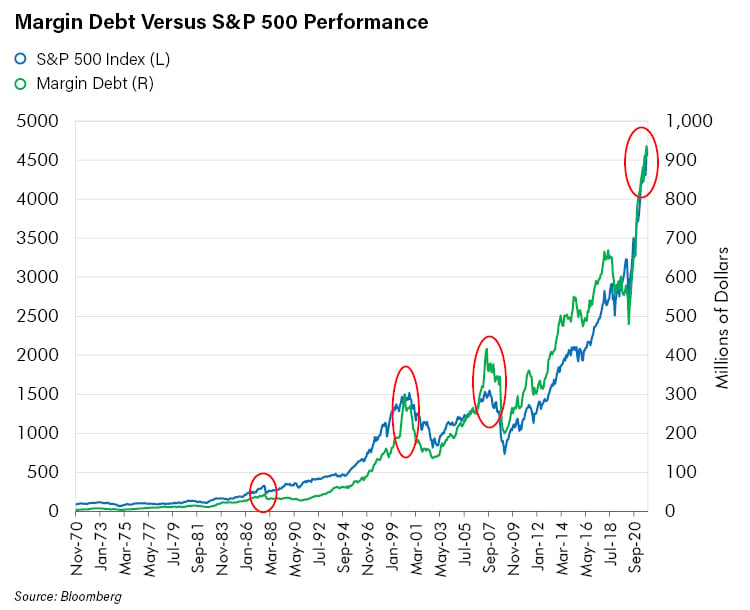
The interesting thing to note about all this is that, at least with respect to investing, our natural bias should actually be the opposite of what psychology has found to be true. In investing, as bullish trends continue and recency bias forgets past bear markets, risk aversion declines. The longer this lasts, the more investors tend to embrace risk. At the top of bull markets is when risk appetites peak. That phenomenon is illustrated in the chart below. The chart shows outstanding margin debt versus S&P 500 performance. The willingness of investors to borrow money and take on margin loans to buy stocks seems to be a good proxy for their willingness to take on risk. As the chart shows, that risk-taking goes up as the market goes up and peaks at market peaks.
Shouldn’t investors be doing the exact opposite? It appears that given the nature of these biases, such as that good news raises expectations for future good news irrespective of whether that expectation is justified or not, the actual probability of bad news and therefore a trend change rises over time. So, if a positive trend is likely to end at some point in the future and it has been going on for a very long time we think the prudent thing to do is lower risk.
Current Trends and Risks
All the arguments we have cited so far do not have anything to do with actual fundamentals. Obviously, the fundamentals of the economy, company performance and valuation are what really matters in the long run, not the trend. We have merely noted that the way those things are viewed is usually with bias. Probably the most important recency and trend bias that is factoring into play today is that of the so called “FED Put.” That is the expectation that the Federal Reserve Board (FED) will take whatever action necessary to prevent a market decline and that it will succeed. A related bias is that authorities around the world will do the same thing, most notably, the Bank of China and other authorities there. Paradoxically, right now, the FED appears more likely to tighten than to loosen. In the past, such an environment has been more challenging for stocks. Similarly, Chinese authorities have taken actions to cool off the hot residential real estate market. That has led to recent weakness and upheaval in the securities of companies in that sector and is a warning that help might be needed soon from the Chinese authorities. If further weakness ensues, we believe eventually an attempt to rescue falling markets will take place. If the weakness spreads to the United States, we believe the FED will be forthcoming with loosening and other measures designed to underpin asset prices. However, will these actions arrive quickly enough and will they succeed? No one knows for sure, but recent history may bias investor confidence.
Another area where investors might currently be impacted by these biases is their seeming cavalier attitude about government debt. Debt levels have marched steadily upward since the 1970's. During the 1980’s many prestigious economists and financial thinkers warned of the negative consequences of too much debt. Those consequences, at least to equity prices, have not come to fruition - not even close. Does forty years of nearly uninterrupted government debt growth with benign results mean debt can grow indefinitely without ever causing a negative result? It seems there could be a fair amount of trend bias in such a forecast.
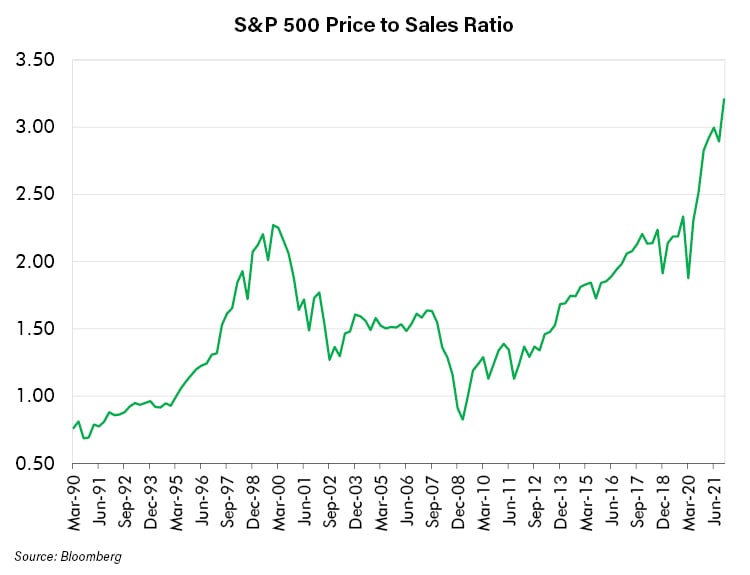
What about recency and trend bias in valuation? One often hears about reasons why traditional valuation metrics are no longer relevant. “It’s different this time” has been claimed a lot lately. However, traditional valuation metrics are merely a means to understand the economic return a business is likely to generate at its current price. It is hard to understand how that can ever be “different this time” or unimportant in evaluating a business. Isn’t the purpose of a business to make actual money, not just money for its stockholders? Can stockholders make money indefinitely without the company making money? As we noted above, there is a price at which any business becomes too expensive. In late 1999 near the height of the internet bubble, many pundits were saying similar things about traditional valuation metrics when the S&P 500 hit well over two times sales as the chart above indicates. That was by far a record at the time. Now valuations are even higher. Breaking the 2000 peak and marching to 3.2x price to sales is not evidence that the former peak and the subsequent values are reasonable. More likely, those saying "I told you so" on valuation not being too high are suffering from recency bias.
Conclusion – Trailing The Indices
The question really comes down to when to be cautious or not. If one becomes cautious too early during a bull market one underperforms. If however that bull market turns into a bear market, caution is likely to be rewarded. Given the biases that distort the way investors process information as a sustained bull market grows, those who recognize this bias and become cautious are usually punished at first. We are among the group of investors that see the bias and would rather under-perform than take risks others are embracing after a long bull market. When we look at economic metrics, recent performance and valuation in an unbiased manner, it is impossible for us to not pull back on risk-taking. Given that we have no way of predicting exactly when the expected negative adjustment will occur it is hard to avoid lagging indices buoyed by excessive risk-taking begat by over-optimistic biases. Sometimes the wait can be nerve-wracking but, in our opinion, the longer and more frustrating the wait is, the closer to the payoff one gets and the greater its rewards will be. Abandoning discipline because recency and trend-biased investors become more and more emboldened may be the worst mistake an investor can make. In our view, those times are when prudent risk management is the most valuable.