History is full of helpful lessons for investors. If only we would heed them! Of course there is so much in the broad sweep of history – upon what should we focus our attention? I have long been an advocate of the vast trove of information that we can find in prices. Perhaps unsurprisingly, therefore, I have gone to great lengths to study historic pricing series over the longest possible time-frames to seek the knowledge that they may contain.
This week’s “Trends and Tail Risks” is devoted to studying this data to ask an important question we first began to explore a few weeks ago (“Unexpected Change,” 3/25/15). Then we noted that our bearish expectations for commodity prices had played out. The overly bullish expectations that once were so widespread in commodities had crashed on the rocks of reality. The once huge gap in the steel sector, for instance, between our own very bearish expectations and those of an overly bullish consensus had closed in our favor with the collapse of the steel cycle when the inventory cycle turned from restocking to destocking late last summer (“Unsustainable Steel Premiums," 9/3/14 and “Revisiting the Inventory Cycle,” 10/1/2014).
When our once-contentious bearish expectations were priced into the market, it was a reasonable question to ask if we were finding sufficiently compelling valuations in the long-beleaguered commodity sector. Our interest was heightened due to our long study of the inventory cycle ("Making Volatility our Friend: Trading the Kitchin Cycle," 5/28/14), which was the “surprise” catalyst that worked to depress equity and commodity values not just in the steel and iron ore sector, but globally across sectors as diverse as crude oil ("Crude Oil’s Black Friday," 12/3/14) and other commodities.
As we surveyed the cyclical and commodity sector globally, we were increasingly finding compelling valuations that offered limited risk of loss, strong dividend support, and excellent prospective upside for patient investors ("Seeing the Ball Clearly," 4/15/15). The two stocks that we profiled then, iron ore producer Vale (VALE) and pulp producer Bracell (1768 HK) have appreciated 20% and 30% respectively in the last two weeks alone!.
Our interest, however, is not on short-term trading profits but rather on long-term investment results. Do we find ourselves now at a point in the cycle when compelling valuations may unite with an improvement in commodities’ long-suffering fundamentals? We believe the answer is “yes!” In the paragraphs below, I outline a deeper dive into the history of commodities and their long-term prices, to see if perhaps we now find a compelling investment opportunity in the commodity sector.
Commodity Prices in the Very Long Run
On April 15th ("Seeing the Ball Clearly," 4/15/15) we outlined the post-World War II commodity price series of the equal weighted CRB Index (CCI Index in Bloomberg). We noted that the now five year long and 41% decline in commodity prices suffered by this index is unprecedented in post-World War II history. As a student of history, I can promise you that this look at the data immediately had my attention!
But what is the message of the even longer-term pricing series? Just how rare is this recent commodity crash? Is there any hope that the move off of these dreadful lows could be as rare - and powerful - as the price crash they have just suffered? The chart below illustrates an index of wholesale prices from Roy Jastram’s original 1976 monumental work Golden Constant which was recently updated through 2007. This first chart displays only the period from 1560 to pre-World War I. We will then examine post-World War I data a few paragraphs later – which shows a very different and interesting trend.
I examined the historic data to look for historic precedents with the following characteristics: (1) a consecutive five year decline and (2) a drop of at least 40% in Jastram’s long-running time series of indexed wholesale prices (1930 = an index level of 100) that stretches back to 1560. The more I studied the data, the more likely I concluded that we are increasingly due for a trend change from falling commodity prices to rising commodity prices.
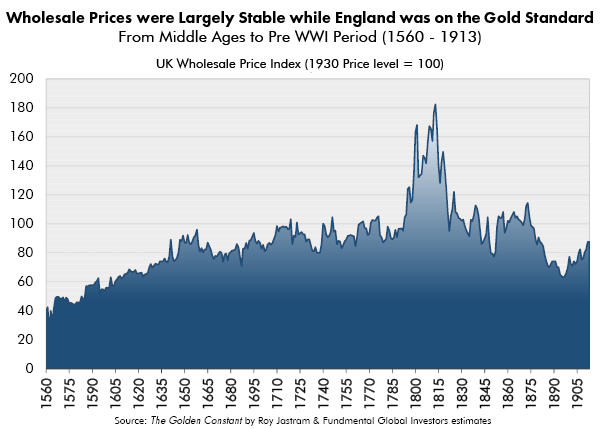
In the UK pricing series there was a one year decline of 40% in 1562 which appears to be tied to the end of the English First War of Religion. And then again in 1822 a four year, 48% drop was a policy decision of the Bank of England to deflate the pound back to its pre-Napoleonic War parity after leaving the gold standard in 1797 to fight Napoleon.
From the period of 1560 to 1913 we can see that this decision to leave the Gold Standard to allow England the freedom to inflate and fight to the death with Napoleonic France was the most noteworthy price move during more than 350 years of pricing history. Otherwise, during this period prices were mostly steady for centuries while England followed the rules of the Gold Standard and kept its currency pegged to gold at a fixed value. Wholesale prices did demonstrate some volatility around a steady value, but there were few secular trends otherwise. Most major deflations were caused by explicit policy decisions to restore discipline to an inflated currency after the all-out effort of a war.
All this Changed with World War I and a Renewed Fight for Survival – Once more the Gold Standard was Abandoned. But this time - Wholesale Prices and Commodity Prices would Never be the same.
The fateful battle of Western Civilization took place in World War I when countries mobilized for total warfare, and following a pattern of many centuries, temporarily freed their currencies from the rules of the Gold Standard to allow the government to bring the full resources of its civilization to bear in this struggle. The step function change this marked in England’s pricing history from 1913 onwards is shown below.
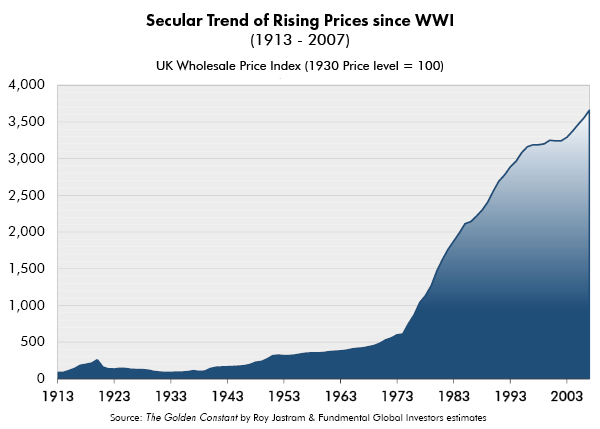
A sharp run-up in commodity prices took place during World War I, which the English government tried to counteract in the mid-1920s using tried-and-true means of a policy of post-War deflation. What had worked for so many centuries drove a very severe contraction in commodity prices. Of course what was a calamitous collapse at the time can barely be seen in retrospect. Rising unemployment and civil unrest finally broke the English attempt at strengthening their currency (“Ghosts of Invergordon?” 6/4/14). The English government left the Gold Standard to stimulate its economy by depreciating its currency. Four centuries of stable prices was over.
The initial post-World War I commodity crash was 40% during a three year drop ending in 1923. Churchill began in 1925 a policy to deflate the pound back to its pre-World War I value which he called in retrospect his greatest mistake ever. Unemployment rose as did company bankruptcies. It was a very trying time for England. This commodity price crash was a direct policy choice that endured for eight years but ended in 1932 when the UK left the gold standard during the Great Depression. After that major deflationary calamity, commodity prices would rarely experience such an extreme downturn.
Turning to post-World War II data in the U.S., we experienced a 40% commodity decline off of the secular peak in 1980. Even then commodity prices did not fall for a full consecutive five years. The same was true in the Lehman induced crash of 2008 from which we immediately rebounded. Essentially four hundred and fifty years of data shows that we have - including now - only six instances of such deep and enduring commodity crashes. So we are witnessing an event so extreme that on average it takes place only once every seventy-five years – even when viewed over the very long term of five centuries of data!
In Conclusion: Perhaps the Stars are Starting to Align for Commodities? Is this a Once in a Generation – or Once in every Two Generations (!) Opportunity?
Certainly it seems anomalous to me that other asset prices, such as stocks and bonds, are flirting with all-time highs in many markets - yet commodity prices languish far under old highs. Half a millennium of data suggests that the current five year long collapse in commodity prices finds only a handful of precedents.
When we examine the sweep of this long-term data, we can clearly see that most major commodity crashes take place during policy-driven deflations when central bankers are seeking to increase the value of their currencies. These rare deflations are the explicit policy decisions made by central bankers to deflate commodity values through strengthening their currency values. Examples include the post-Napoleonic War deflation in England and the UK’s aborted attempt at a similar currency strengthening deflation after World War I. I would ascribe our own Great Depression in the U.S. to a policy of overzealous deflation that did not recognize the extent of the damage created by our prior inflationary credit boom in the Roaring ‘20s.
In the U.S. more recent policy driven examples include Paul Volcker’s decision in 1980 to force the U.S. into a painful recession by elevating U.S. interest rates above 20%. Volcker was determined to pursue a policy of deflation to break the back of inflation and restore stability to the dollar’s value, and thus deflate the value of commodities that are denominated in those strengthening dollars.
Certainly when I survey today’s world, I see no comparable evidence of such discipline among any major currency’s central bank to drive stability in currency values. If anything I see just the opposite: spreading evidence of a “race to the bottom” where central bankers have been vying with each other to spur growth at any price. Once extraordinary policy measures are now commonplace. Furthermore, nearly everyone is convinced that the need for such radical central bank policies is now behind us. But is it really? Time will tell.
Just this morning US GDP came in at only 0.2% year over year growth in the first quarter - in what was supposed to be the year that the U.S. finally returned to more “normal” growth after years of extraordinary central bank stimulus both in the U.S. and abroad. I am very open to the possibility that the world may not have seen the end of “unconventional” monetary policy nor the end of “activist” central bankers using their full powers to stimulate growth via currency depreciation.
If this is the case, then I would submit that today’s extremely depressed commodity prices are not only unsustainable, but also could benefit from a tailwind of further aggressive reflationary policies by the world’s central bankers. Furthermore, the combination of a turn in the inventory cycle from destocking to restocking could be the catalyst that revalues commodities to a more sustainable level.
In further editions of “Trends and Tail Risks” we will take a deeper look at consensus expectations in order to gauge just how surprising a reversal in commodity price trends would be from down to up. Our preliminary belief is that consensus expectations for commodities are extremely muted after their now five years of sustained underperformance. Should this hunch be confirmed, then all the necessary preconditions for an historic rally in commodity prices would seem to be in place.
All that would be left would be the issue of timing – no small affair to be sure! However, all we can reasonably do to prepare for an uncertain future is to increase our optionality to a brighter and unexpectedly good future while we minimize our risk of disappointment while waiting for the cycle to turn. Patience, the final raw material needed for excellent returns, would then become paramount. Perhaps we now find ourselves at just such a point in the commodity cycle? Stranger things have happened! •