CHIEF CONCLUSION
Last week the equity market suffered the fastest drop ever from an all-time high. We believe that the violence of this collapse makes a strong case for professional risk management and thoughtful asset allocation. Perhaps the speed of this collapse may sober those investors whose “strategy” was to plan to somehow exit the equity market right at the peak. Steely eyed, did they sell everything – as they were sure that they would – nailing the top of the market (so far) just a few days ago? No? Did the ever-fickle Timing Fairy not call them? Well, don’t feel bad. She lost my phone number too. Long ago I sought out a more thoughtful way to manage risk, one that was not dependent upon pinpoint timing. I have come to believe the answer is superior trade structure, powered by diversification and asset allocation, as explained below.
Diversification for our research team takes two forms: 1) owning equities that are different from the market, and 2) having an appropriate asset allocation, or mix of different assets - such as bonds - to mitigate the risks of an equity-heavy portfolio.
Two weeks ago, we noted the diversification benefit we believed investors could find through the ownership of a different mix of equities than that of “the market,” especially in the gold sector. Our argument was that historically extended valuations in the tech sector could add risk to the market, to the benefit of the gold sector.
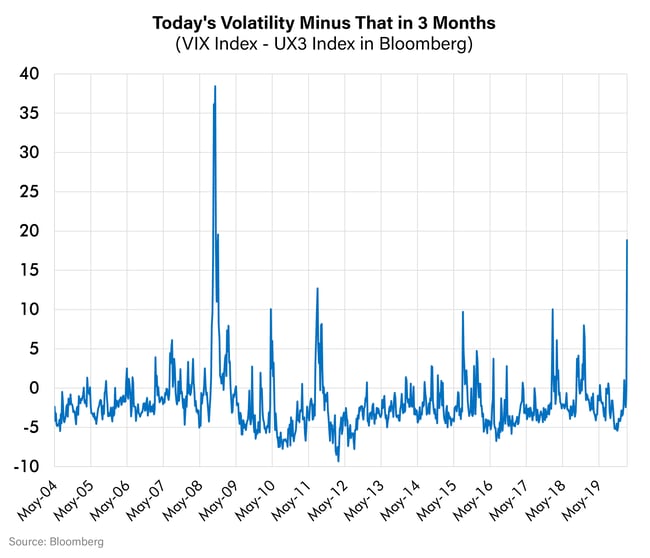
The gold sector held in there – for a while - with some equities jumping to new all-time highs on Monday as the equity market melted down. But not for long. The sector faded fast as correlations rose dramatically across all equities. My experience is that indiscriminate forced liquidation can drive such powerful selling pressure. But thankfully, this tends to happen only rarely, during the most extreme selloffs, like the one last week. Why? Because it’s rare to see such an incredible degree of forced liquidation. We show below one indicator, the term structure of volatility, to measure the degree of this phenomena, which shows we haven’t seen anything this violent since Lehman failed during the Global Financial Crisis, at least on this measure.
We calculated the below chart with data from Bloomberg, which subtracts the futures price of volatility three months forward (UX3 Index) from current stock volatility (VIX Index). Typically, current volatility trades at a discount to future volatility, meaning this number is usually negative. But not last week! Last week displayed a ferocity unmatched since Lehman’s failure. Last week’s spread of current volatility to future volatility traded as high as 27 intraday before closing at 18 on Friday. It’s been twelve years since that has happened.
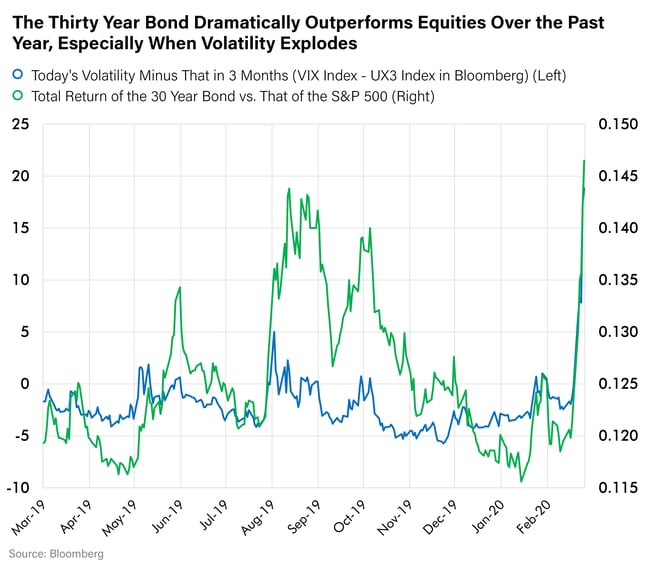
This time, as twelve years ago, once losses begin to mount – the cycle of selling can become universal until de-leveraging runs its course. At such rare times, forced selling can eclipse the diversification benefit of even the most thoughtfully constructed equity portfolio. That is why our risk management plan doesn’t stop with equities. Rather our risk management plan extends to diversification among other asset classes too– particularly higher quality bonds such as U.S. Treasury bonds (often called the long bond).
Long time readers will recall that I have authored literally dozens of research notes in the past few years about the merits of higher quality, longer dated bonds to diversify an equity rich portfolio. Certainly, last week was a powerful illustration of this principle in action. While the S&P 500 fell 11.7%, Thirty Year U.S. Treasury bonds rallied 7.4 percent! In fact, as the chart below demonstrates, these bonds did their job relative to equities even while (or perhaps was it thanks to?) the explosion in the term structure of volatility. To me, this demonstrates one of the most exemplary merits of Thirty-Year U.S. Treasury bonds, their embedded optionality to the higher volatility that can be so ruinous to equity prices. You could be forgiven for concluding that U.S. Government Thirty Year bonds are the Swiss Army knife of equity hedging.
In my experience, very few investors give the lowly long bond the respect that its performance has earned. Can you find another investment that trades as if it is inherently long volatility, that pays you to wait while you own it, and is one of the most liquid investments on the planet?
But Wait! There’s More…
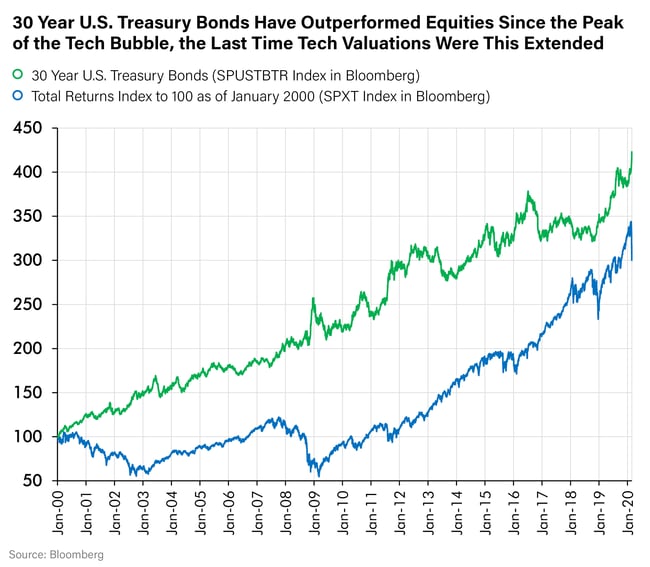
You could be forgiven for thinking that the bond’s powerful performance of recent days is a short-term fluke, and nothing more. But there you would be wrong, as the chart below demonstrates.
This illustration shows the total return, starting from a base of one hundred, of two investments: the venerable S&P 500 and the lowly long bond. You will note that the bond has dramatically outperformed the S&P 500 starting from the peak of the U.S. Tech Bubble, the last time Tech valuations were this extended. That was a full twenty years ago! Two decades of outperformance by the lowly bond! Makes you think, doesn’t it!?
In Conclusion
If you needed any convincing on the merits of diversifying outside of equities, particularly into high-quality bonds, especially the longest-dated U.S. government treasury bonds, I would submit that last week should have done it for you.
The long bond, despite seemingly near ubiquitous revulsion towards it, has displayed – in our opinion – fitting attributes of one of the most remarkable and versatile investments on the planet. It pays its owners an income stream backed by the full faith and credit of the U.S. government and its powerful taxing and borrowing capacity, befitting the world’s remaining superpower. It is fully liquid, and the long bond’s returns have been highly additive to an equity rich portfolio. It often zigs while equities zag. Certainly, it did so last week! Finally, the bond’s long-term track record demonstrates strong performance over multiple cycles. This, to me, demonstrates that the long bond is not just valuable to own when equities are weak. It has been valuable to own, period, for many decades.
We retain our long-term bullishness on select gold-related equities and how they can diversify an equity rich portfolio. But our risk management discipline doesn’t stop there. Our unshaken belief is that asset allocation, the ownership of a broader range of assets than just equities, is a valuable pillar of portfolio diversification. Was this not the chief lesson of last week’s equity carnage? That is what our research team focuses on: trade structure, not market timing.
For those of you still waiting by the phone for the Timing Fairy to call, our suggestion is to move on. We think there is a better way forward. Our research team suggests that asset allocation – including the ownership of higher quality, longer dated bonds - may be a far better way to mitigate the risk of late-cycle equity investing in this, the longest cycle in post-World War II history.