CHIEF CONCLUSION
Today we take a brief look back at the message of our trusted indicators, in particular the insight of the yield curve. Our goal is to thoughtfully inquire into three questions. First, where we are in the cycle? Second, what does the data suggest is the optimal asset allocation? Third, what are the indicators and trends that will guide our evolving thought over the coming months? We walk through the tools we are using to evaluate these issues, with an eye to historic precedents and the strange forces at work in the year 2020, seemingly the strangest of all years.
"The intelligent investor is a realist who sells to optimists and buys from pessimists."- Ben Graham
Frequent readers will recognize that a long-standing core belief of our research team is that we constantly re-evaluate our investments and our asset allocations. But re-evaluating is not the same thing as acting. Let me be very clear: we don’t “set it and forget it.” Our view is that a dynamic world calls for a dynamic investment stance. That doesn’t mean, however, that we move without deliberation. We will often agonize over potential changes for weeks or months, sifting and resifting the data, referring to market-based leading indicators that help us gauge the all-important question of: where are we in the cycle?
Our more than two decades of professional investing experience has taught us that change happens – and that change can be good for your investments – if you can properly anticipate it. This is easier said than done.
One of the most important risk management principles we have flows from our belief that the deeper we get into an economic cycle, the more we de-risk our investments. Our goal in doing so is not to “hide” in cash. We believe “hiding in cash,” which we see so many others do, is a failed strategy for many reasons. First, it seems to gladly embrace lower returns while trying to time the market. This presupposes a market timing ability that almost no one has proven to have over the long term. Second, and perhaps even worse, it represents to us a failure of imagination. We think a better solution is to think creatively, and to challenge ourselves as a research team to find a way to make money, even if times are challenging.
So, since our goal in making investments is not to “hide in cash” but rather to make money, how do we try to do that when markets become challenging? I think this is one of the biggest challenges we face. It requires a different perspective, a willingness to be early – and sometimes to willingly underperform in the short run while doing so with the goal of better performance in the long run. This means our stated goal is to really shine during the most stressful time in the markets. We would rather not have to make the same money twice. We would prefer to keep the money we have and grow it.
But this pattern of returns may be different from that achieved by “the market.” After all, it appears to surge when risk taking boils over, and crashes when risk taking cools off. What a horrible way to navigate the investment world, in our view, taking the most risk at exactly the most dangerous times, when everyone else is embracing it. We would much prefer to take our risks when the rewards for taking them are the highest. But to do this, of course, demands clear communication about why our portfolios look increasingly different from “the market” as we get deeper into the cycle.
"Some things benefit from shocks; they thrive and grow when exposed to volatility, randomness, disorder, and stressors and love adventure, risk, and uncertainty." – Nassim Taleb’s “Antifragile”
It was with that goal in mind that, almost two years ago, we wrote about why gold-related investments and long dated U.S. Treasury bonds were becoming a bigger part of our asset allocation. It wasn’t that we foresaw the specific challenges that lay before us, such as the Covid-driven economic collapse; no far from it. However, we had learned something in our two decades of professional investing about the future: when in doubt, consult time-tested forward-looking financial indicators. These have proven their merit to us over many cycles and suggested then that the traditional drivers for the bull market were losing vigor - fast.
The last two years’ market action is highly instructive of the value that cyclically aware asset allocation can bring to a portfolio in terms of increasing returns while minimizing risks. Investors who owned gold and long-dated U.S. government treasury bonds have experienced better returns with less risk.
In 2018, I was interviewed on CNBC, where the charming but persistent co-host repeatedly questioned my logic of bonds as a portfolio diversifier not once, not twice but three times. To those that have not been investing as long as I have, I could see how it might seem mortifying that they basically called me an idiot live on the world’s most famous financial news network. It seems in hindsight I was on to something.
This experience reminded me of a pithy and insightful quote from a co-worker at T. Rowe Price, Steve Boesel, one of that firm’s most experienced portfolio managers. Way back in 2002, when I told Steve that my single highest conviction investment idea got laughed at by my peers, he told me “Laughter is bullish. In fact, laughter is better than panic - with less downside.” This meant a lot coming from Steve, who I had seen the panic-driven lows of many buying opportunities. I think Steve was the single best value buyer of securities with whom I ever had the pleasure to work. I never forgot what he told me.
I completely understand why my logic was questioned at the time, because these bonds and gold were both coming off of a depressing two year run of subpar performance. Both were in fact down over the prior two-year period, while the equity market was up nearly 35%. Talk about a period of strong underperformance. But as the disclaimer reads, past performance is no guarantee of future results.
The most important point, as always, was not what had happened in the past, it was what might happen in the future, and how best to construct an appropriately defensive and diversified portfolio. So, a key takeaway of this exercise, in our opinion, is that the best asset allocation is often one that takes into consideration where we are in the cycle, and a willingness to move early, ahead of the necessity of doing so.
Risk Management in an Uncertain World: Insight from the Yield Curve
It might be worth revisiting our earlier research on this topic, that raised the topic of the predictive power of the yield curve. For example, the trend of the yield curve below, the 10-year yield minus 30-year yield curve, was testing the upper ends of its long-term trend line in late 2018.
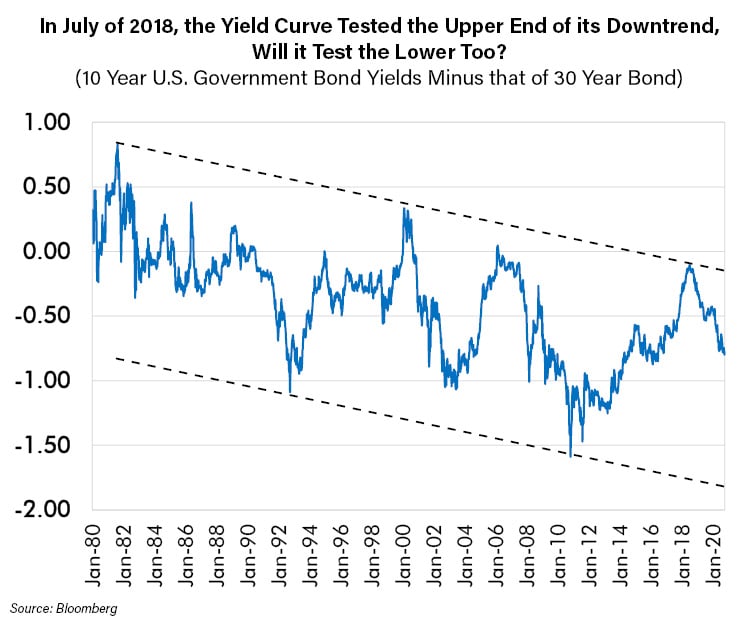
The question we asked then was this: would the yield curve this cycle prove to be as insightful as it had been in past cycles, when peaks in the curve marked the peak of the stock market’s outperformance relative to safer assets, such as long dated U.S. government treasury bonds. The chart below is updated to show the more recent trend. Once more it seems remarkable that this simple indicator has sensed the deeper truth where we were (and are?) in the cycle. Within days of the peak of this yield curve, equities would begin a trend of underperformance versus U.S. government 30-year bonds that continues to this day. This truth may be obscured by the huge bounce in U.S. equity markets but nonetheless they have continued to lag the returns of U.S. government bonds for more than the last two years, as the chart below demonstrates.
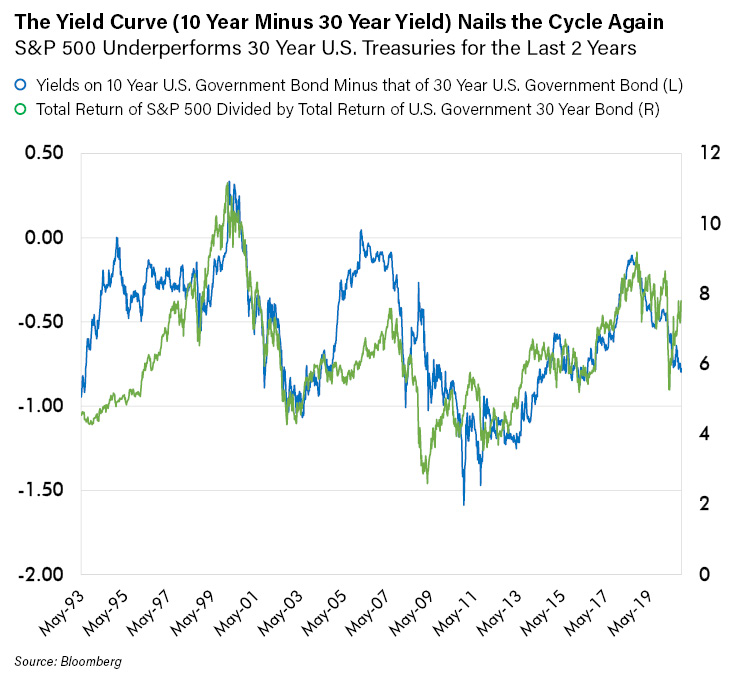
A Look at History Suggests Equities May Continue to Lag Long Dated Treasury Bonds Until the Yield Curve Troughs (a while from now). Or is This Time Different?
“Lethargy bordering on sloth remains the cornerstone of our investment style.” – Warren Buffett
One of my favorite investing quotes is this: the four most expensive words in the English language are “It’s different this time.” This betrays my own bias, that things are rarely if ever different. But with how much confidence can we say this in the crazy year of 2020? After the Covid-19 pandemic and the most unprecedented fiscal and monetary stimulus in history? It’s frankly hard to slam the door on the argument.
At the same time, however, I think often of Mr. Buffett’s quote above, and the wisdom in it. To me, its greatest insight is the imperative to remain patient. Mr. Buffett stresses this point because it’s so hard to do. We will happily change our minds when the facts change – and when better investment ideas displace good investment ideas. But have we seen the evidence that we should revisit our asset allocation? I think the data is inconclusive, though we remain open minded.
To me, perhaps the greatest power of diversification is that it’s a pro-active risk management tool for an uncertain future. I think I can convincingly argue that the world has never been more uncertain, at least not in my investing lifetime, nor in the history of financial events that I have studied. If ever there was a time that demands thoughtfulness, vigilance, and a brutally open mind it’s now. These – and our trusted indicators such as the yield curve – are the tools on which we rely to navigate an uncertain future.
“If I had an hour to solve a problem, and my life depended upon it, I would spend the first 55 minutes determining the proper question to ask, for once I know the proper question, I could solve the problem in less than five minutes.” – Albert Einstein
In Conclusion
I wish I could tell you that our research team has all the answers. We don’t. We may, however, know the right questions to ask. And that is a start, as we consult the lessons of history and monitor our trusted indicators.
We do not yet see sufficient evidence to over-ride, in our opinion, the durable lesson of the yield curve. Namely, that the diversification benefit of long-dated U.S. Treasury bonds (and gold) can be the most valuable to investors once the yield curve peaks and begins to decline. We are now more than two years into that decline. Will past be prologue and the yield curve decline until it hits the low end of the channel that has defined the low point for decades? If so, that’s a long way down from here.
Or might this period be like 1998, when the yield curve dipped then rebounded strongly, taking risk assets with it? Then, the shock of the Asian Crisis prompted the world’s central bankers to panic and flood the market with excess liquidity. (Sound familiar?) This liquidity created what in retrospect would come to be called “The Internet Bubble.” Though it was a fun ride for almost two full years, its most lasting impact was heartache as high-flying tech stocks crashed 90% or more. Frankly, given the dominance of tech in today’s markets, many could argue that this precedent is valid for today. However, one key difference between then and now is the dramatic weakness underway in financial stocks in the U.S. particularly among banks, which strongly participated in the melt up off the 1998 lows. Now, not so much. This makes me pause in labeling events as a repeat of the 1998 period.
Perhaps another scenario may be Japan? Long mired in slow growth and vigorous central bank “stimulus,” its equity markets continue to levitate, despite lackluster economic performance, low bond yields, and banks that massively underperform its otherwise rising stock markets. Might Japan be our future? Certainly, it’s our present, for now at least.
Finally, another scenario, by far the trickiest to navigate, is that there simply are no precedents. Can you think of another time when massive monetary stimulus combined with a workforce locked at home, with an investing grubstake care of the government, trading stocks online - with no-cost commissions!? I cannot.
As we think through these questions, we are grateful for the benefits of diversification, and hope that you are too.