“The unfortunate features of the oil history of Pennsylvania have been repeated in the later history of almost every other producing region. There has been the same instability in the industry, the same recurrent or chronic over-production, the same wide fluctuations in prices, with consequent curtailment agreements, the same waste of oil, capital, and of energy....All saw the remedy, but would not adopt it. The remedy was, of course, a reduction in production.”
-“The United States Oil Policy,” Professor John Ise – 1926
Crude oil joined the Black Friday tradition of holiday sales with its own price cut, falling by one of the largest modern single day moves ever. Of course, the near-term cause was the unanticipated decision of OPEC to not curtail excess crude oil production capacity. The market interpreted this move as a meaningful signal that emerging crude oil oversupply, largely powered by growth in higher cost US shale oil, would be greater and last longer than almost anyone was anticipating. As one would expect, an even more violent reaction took place among the high cost US shale oil producers whose equities fell as much as 50% in two days.
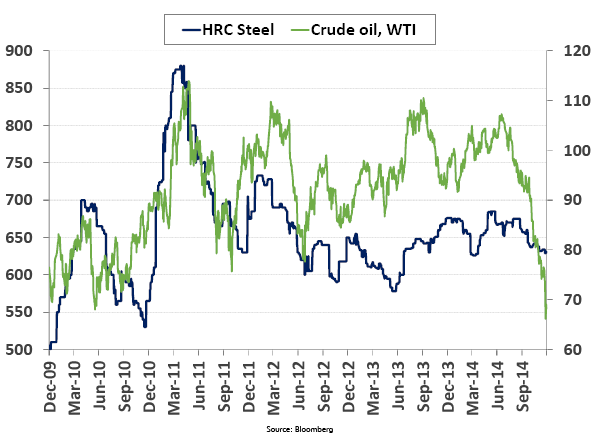
There was no need for investors to have been caught by surprise, however. Crude oil’s crash has now “caught down” to the weakness in steel that we have been anticipating since May as we began to warn of the coming inventory destocking cycle (Making Volatility our Friend, May 28, 2014; Revisiting the Inventory Cycle, October 1, 2014). These moves are not surprising when you consider that crude steel and crude oil are among the world’s largest commodity markets. In recent weeks, as the chart below illustrates, these markets have been trading together. If anything, I have been surprised that the price weakness in steel has been less violent than that of crude oil – so far.
Commodity prices tend to overshoot from extreme to extreme. We have been relentlessly bearish on steel since May. Even though we may be perhaps two-thirds through the inventory destocking part of the down cycle, what does the longer-term future hold for steel and crude oil prices? Is it equally dismal? We believe the answer could be “yes!” But we may also anticipate many positive developments in other sectors. In this week’s Trends and Tail Risks we examine the precedent of the 1985 - 1986 crude oil price collapse -- and OPEC’s role in it -- to see how we may apply the lessons of the past to the future.
But first it is important to understand the simple processes at work. We have touched before (Prices Allocate Resources, June 25, 2014) on the simple but powerful role that prices play in the economy. The crude oil market is oversupplied. To fix this imbalance, the market is reducing the supply of crude oil by lowering the incentive price that is available to producers. Producers who cannot produce profitably at this new and lower price will cease production and may go out of business entirely. As the excess of supply relative to demand falls, prices can stabilize and even start to rise again at the end of this process.
I have to recommend Daniel Yergin’s Pulitzer Prize winning book on oil, “The Prize.” Though written many years ago, its lessons remain as fresh as if it were written yesterday. It was to this book that I turned when I wanted to revisit the lessons of the 1985-1986 collapse of the OPEC cartel and the crude oil price. In retrospect, this proved to be one of the most important events of that decade. Lower oil prices surely led to the collapse of the Soviet Union, one of the world’s largest crude oil producers. From this followed the end of the Cold War, the reunification of Germany, and the adoption of the capitalistic system by tens of millions of people. Lower oil prices were a big deal.
History shows that it is wise to respect the volatility of the commodity markets. Crude peaked in November 1985 at $31.75 a barrel but managed to fall as low as $6 by 1986. A decline of 82% - now THAT is low! When we train new analysts we stress again and again that “the impossible” happens every day in the commodity markets. Certainly in 1985 the Saudis did not think that the price war that they kicked off would end up being do deadly. As prices fell, oil producers, especially those located in the US, cut back on exploration and drilling. Brand new equipment sat idle and was auctioned under the bankruptcy court gavel for pennies on the dollar. Those who had borrowed too aggressively to finance their oil business were even less fortunate. They lost everything. With oil-driven prosperity gone, great swaths of the former “Oil Patch” in the US went into Depression. The weakness extended far beyond oil companies and enveloped banks and local businesses as well. Boom had turned to bust.
In fact, the price decline got so bad that US policy makers began to talk about oil price weakness compromising our national defense. Many oil market observers also believe that rivalries among producers, especially the Saudis vs. the Iranians, may have exacerbated the split in OPEC. Surely that enmity has not diminished. What are the lessons of history that the Iranians and Saudis have learned? Surely we can trust that Vladimir Putin knows his history and understands the great challenge that Russia now faces. Mikhail Gorbachev was willing to preside over the peaceful dissolution of the Soviet Union as its oil-driven economy collapsed. What will President Putin do? Whatever path he chooses, circumstances may not afford him the luxury of waiting. Much depends upon the course of action he takes.
Trouble in Paradise?
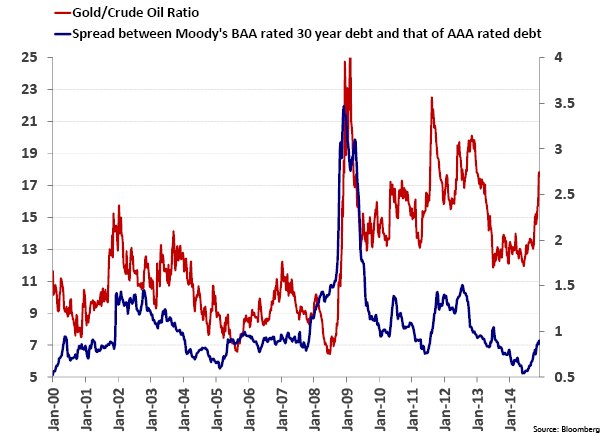
Finally, I think we can close this week’s research note by taking a renewed look at crude oil in gold terms. Long-time readers will recognize that I am an advocate of looking at prices in gold terms, to strip out the long run impact of currency volatility. In the chart below I invert this chart to look at the relative performance of gold versus crude oil. A rising ratio shows the growing purchasing power of gold, how much crude oil one ounce of gold can buy. Gold is on a tear right now versus crude.
This is not altogether happy news, however, as we outline in the other index shown in the chart, the BAA-AAA spread. The BAA-AAA spread shows the yield premium that bond investors demand to own the more risky debt of a Moody’s BAA rated credit versus a more highly rated AAA company. Frequent readers of this publication will quickly recognize a common theme of our research that links a rising relative value of gold to rising credit stress (Gold: Price vs. Relative Value, July 23, 2014; Is Credit Quality Peaking?, August 6, 2014; Gold: Lessons from the Depression, August 20, 2014). The chart below shows that remains very true still today.
How could a falling crude oil price be a reason for rising credit stress? Much of the news is only covering how great it is that the “energy tax” on the consumer is falling as prices fall. The US has invested literally trillions of dollars to create the rising oil supply it now enjoys. Much of this investment has been debt funded. One out of every six dollars of high yield debt in the US is now linked to energy. Falling oil prices undermine the economics of many of those investments, hence the rising credit stress below.
Once again in crude we see more proof of the old adage in commodities: capital destroys returns. Shale oil spending and its related impact have been a huge driving force for the US economy. However, was investing trillions of dollars in some of the world’s highest cost capacity really a good idea? US consumers and others who benefit from falling prices will surely answer with an enthusiastic “yes!” Creditors – and shareholders - of soon to be bankrupt, high-cost and over-indebted shale oil companies may greet these events with a little less enthusiasm.
We will be watching the course of credit spreads over the next few weeks to learn the extent of credit contagion that oil’s collapse may cause. One thing we know to be true among all of this uncertainty: large profits await those who can solve the riddle of what the future holds for crude oil and its impact upon credit. We believe that through research, and the disciplined study of history, we can improve our odds of discovering the answer and profiting from it.•