Chief Conclusion
Cycles are always working in one direction or the other in the markets. How can investors avoid being victims of “unexpected” volatility, and better yet, even find a way to profit from it? To this question our investment team has dedicated years of study. Our goal is to build an investment framework that harmonizes the power of company specific, “bottom’s up analysis” while not ignoring the push and pull of the cycle. We have developed quantitative leading indicators as key tools in this effort and believe that this information helps drive better investment timing and superior asset allocation.
The bedrock principle of my investing career is to understand why things happen. Almost everything in the markets happens for a reason. One who seeks to better forecast the future must first understand the forces that will cause the future to unfold. Every cause has an effect; just as every effect has a cause!
This is the most interesting part of investment research as a career: to continually understand more about our world and how to most profitably shepherd investments through it. My education and early investing career were completely based upon in-depth, company specific, fundamental analysis. How does a company make money? How should that company be valued? These are the most important long term questions an investor must answer. But this exercise alone may fall short as too academic, a pale shadow of a more full understanding.
In the Long Run We Are All Dead
John Maynard Keynes was not just an economist, he was also an investor. He understood that many things needed to go right in order for an investment campaign to have a successful conclusion. The proper “long term” forecast is only one aspect of successful investing.
Modern finance has created the term “path dependency” to describe this truth. For instance, if a company’s share price collapses 50% during an “unexpected” down cycle – right after the investor buys it – will the investor have the patience to hold the stock? Is the set back the fatal failure of the investment thesis or is it simply a temporary challenge? Is a short-term economic slowdown to blame or did something important break in the company’s business model? Anyone who spends enough time in the markets is going to be challenged with these questions. Again and again.
One way to think about it is to understand the role of cycles and how they act upon investments. Sometimes they may conspire against them, tempting you to un-necessary despondency and the abandonment of an otherwise sound investment. At other times, cycles may so supercharge the returns of your investments that their fundamentals and valuation become stretched beyond all reason – and only a hasty sale can rescue your gains and save your capital from unwanted loss.
Cycles: What Volatility Can We Reasonably Predict – and Thus Reasonably Avoid?
The study of cycles is hugely beneficial because it helps investors focus on what matters – the long run – by limiting surprises in the short run. No one will ever be able to predict all the shocks an investment may endure, but many can be reasonably predicted – with the right tools.
Among the cyclical forces that we have identified, the most common is the Kitchin cycle, which we have often called the “inventory cycle” in prior research (Making Volatility Our Friend: Trading the Kitchin Cycle, Revisiting the Inventory Cycle, Navigating Confused Seas). Inventory cycles are a temporary fluctuation in apparent demand caused by customers’ actions to hold higher (or lower) inventories.
The steel markets have always supplied us with the best information about where we are in the inventory cycle. Accordingly, we have created a set of leading indicators from our many years of steel research. These cyclical drivers are expressed in the chart below. As the indicator moves farther away from zero and into ever greater extremes, the odds of mean reversion rise exponentially. So while the indicator may show powerful extremes, with blistering volatility in the markets, it will not stay at extremes for long. This framework helps to strip emotion out of the investment decision and makes for better timing.
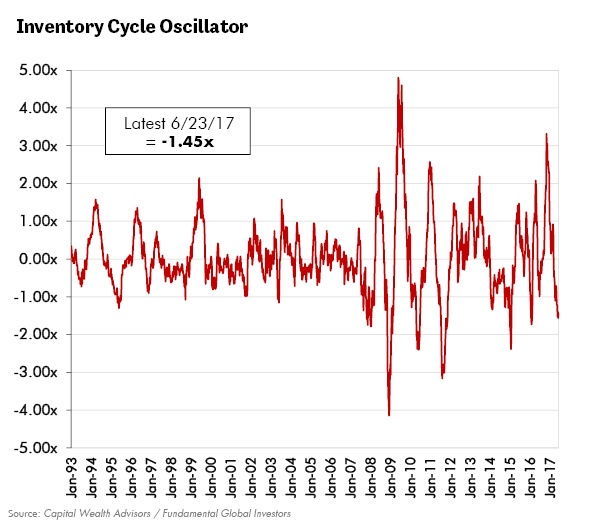
Many of the components in this indicator blew out to unsustainable levels after the Presidential election. A quick glance would have been sufficient caution for the most ebullient investors. For the past several months this enthusiasm has bled from the markets, resulting in price declines of 50% for the highest cost U.S. steel producers.
This indicator illustrates how easily these cycles may surprise the unwary – reversing quickly after accelerating so forcefully into the peak. The eventual reversal out of the depths of the low may be equally shocking to those who do not understand the cycle. For the opportunistic investor, who does understand it, this cycle’s “unexpected” changes can be a source of profit. Our goal is to distinguish predictable but short-term volatility from longer term investment drivers.
Other Indicators: Credit Quality, Long Term Interest Rates, and Gold
Another approach we use is to focus on the drivers of key markets, such as gold and credit quality for instance. We create a mosaic from these markets. Our goal is a more comprehensive understanding from all of them that is superior to the insight from just one market. Rigorous thinking and a focus on their causal drivers helps us to create investable insights.
For instance, the chart below warns us that the leading indicators of U.S. credit quality have slipped into negative territory (negative 0.5). One would expect this given how deeply negative a readout we get from the inventory cycle (negative 1.45), whose volatility impacts many other markets, such as credit quality.
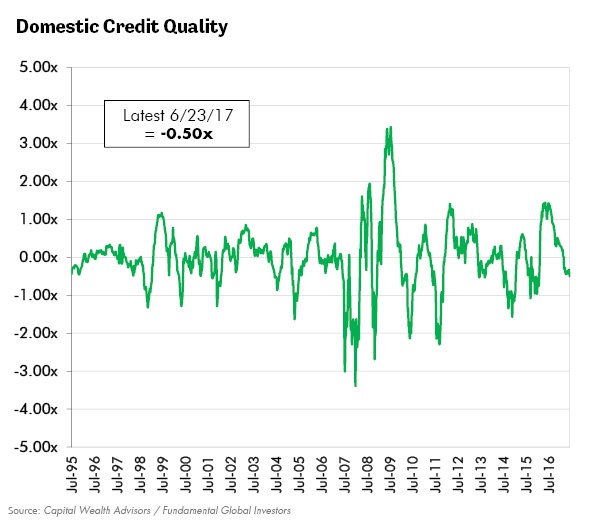
We can ask better questions by studying multiple indicators. For instance, once the inventory cycle indicator peaked and rolled over, it was reasonable to expect the indicators of credit quality would worsen in time, and in fact did so – with a lag. But what happens now? One reasonable interpretation is that we may see more weakness to come in credit. Another hypothesis to consider is that the slowdown we anticipated has almost run its course.
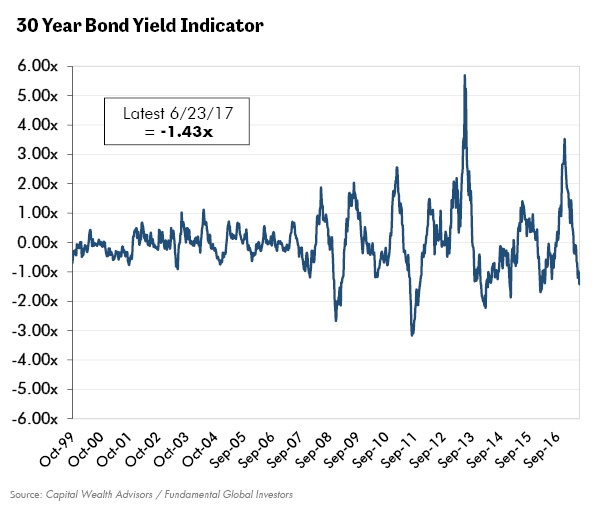
Another common effect of an inventory destocking cycle is falling long-term interest rates. We anticipated this recent decline in bond yields (Bond Weakness is a Temporary Setback and Not the Cycle’s End). Their decline, however, shocked a bearish consensus – even more so with the Fed hiking interest rates! Viewed through the lens of the inventory cycle, however, this decline was predictable.
Triangulating the Cycle: Building Conviction Through Multiple Indicators
The more agreement we find among our disparate indicators, the stronger the conviction that our cyclical view is correct. No view on the cycle is complete without checking in with the ever-insightful gold and U.S. Treasury markets. Below we illustrate their latest readings.
Gold, after blasting off strongly in 2016, has remained muted in recent months. The more noteworthy developments in the gold market have been in gold’s relative value (gold relative to commodities for instance).
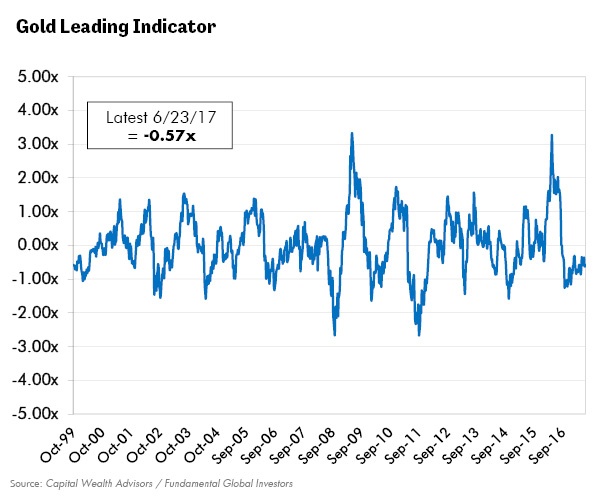
Gold’s strength relative to commodities we outlined in our last note (Ask Better Questions to Make More Money), where we also explained how gold’s relative value has powerful insight it can share on long term interest rates.
Below we can see that in action as our indicator series for long-dated yields powers lower. This move has come as a shock to many observers, especially in the face of the Fed raising interest rates. However, this move is fully in line with not only our strategic thinking (Bond Weakness is a Temporary Setback and Not the Cycle’s End) but also the shorter-term signals from our other indicators. Even the strongest of secular trends, such as falling long term interest rates, may have painful reversals along the way. A more comprehensive understanding of this ebb and flow would enable investors to upsize their holdings at the most profitable times.
In Conclusion
Keynes knew that successful investing is about managing the short run successfully enough to arrive profitably at the predicted long run outcome. It’s also about designing an asset allocation – the mix of stocks versus bonds – resilient enough to withstand cyclical forces.
Cyclical volatility need not thwart our investment efforts. Time and study – and a little creativity in how we process these results – offer the hope that we can master what so many investors have found vexing. The ultimate long-term goal is unchanged: owning the best and most thoroughly researched companies. There is simply no substitute for thorough “bottom’s up” fundamental analysis.
However, a deeper understanding of cycles may turn such research into better profits. There are no guarantees in the markets. We believe, however, that our proprietary system of indicators gives us a unique advantage in navigating a challenging investment landscape. •