CHIEF CONCLUSION
Markets are rightly focused on the future, on where the puck is going, not on where the puck has been. We try to direct our portfolios to where the puck is going through our discipline of a proactive asset allocation. As we get deeper into the cycle, our equity hedges in US Treasury bonds and gold - related equities become strategic in stabilizing performance in a more volatile market. With the recent increase in volatility, is now the time for them to show their worth?
"Skate where the puck’s going, not where it has been.” -advice Walter Gretzky gave to his hockey prodigy son, Wayne
 Wayne Gretzky is considered by many to be the greatest hockey player that has ever lived. Nicknamed “The Great One,” he is the leading scorer in National Hockey League (NHL) history. The only one to score more than 200 points in one season – doing so four times. He holds sixty-one NHL records, including nine Hart trophies as the league’s most valuable player.
Yet Gretzky was tiny by NHL standards, weighing only 160 pounds when he started playing professionally. What made his play so special? He is remembered for three attributes. First, his uncanny reading of the game, of seeming to sense where the puck was going. This led him to execute the right moves at the right time, which Gretzky attributed to practice and deep study of the game. Second, his agility in avoiding the body-slamming checks for which hockey is famous. Third and finally, for making hockey a team sport, about more than just a star scorer, but partnering with all his teammates to share the puck and create opportunities to score. These three traits helped him to become the greatest player that ever lived.
Where did Volatility Come From? What’s Next for Markets?
It’s an often cited Wall Street truism that “What everyone knows is seldom worth knowing.” Right now, it seems everyone knows that the economy is strong and that the Fed is raising interest rates. That is where the puck is. My question for markets is: where is the puck going? This is an important question to ask given the re-emergence of volatility “for no reason,” given the seemingly awesome current conditions in the economy.
It seems you can’t turn on CNBC or read a newspaper article without seeing the “experts” opine upon the latest datapoint covered hourly for your viewing pleasure: today’s CPI numbers, the latest monthly employment reports, the parsed ramblings of the Federal Reserve Chairman. All of them are where the puck is. I believe this attention is misplaced and thus misses the deeper workings of the market.
In our twenty years of professional investing, we have learned to focus on the future, and how the markets are changing. Accordingly, resurgent volatility “for no reason” is not a surprise to us. This is the way the market works. The market always has its reasons. Are we practiced enough to understand them? Are we watching, and understanding, the right things?
“He who busies himself in mean occupations, produces in the very pains he takes about things of little or no use, an evidence against himself of his negligence and indisposition to what is really good." -Plutarch
Two thousand years ago, Plutarch’s “Lives of Illustrious Men” admonished his readers to build the right skills, towards the right goals. His study of excellence in leadership continues to guide those who would lead. We think that the study of markets, their history, and why they do what they do is vital for those who want to succeed in the financial world. Accordingly, we have devoted the last two decades of our lives to learning the tools that may help us succeed.
We have used the pages of “Trends and Tail Risks” to share with our audience many of the tools that we have found to be the most useful. Today we return to one of the most powerful of these, Exter’s Inverted Pyramid, for what it has to say about today’s markets.
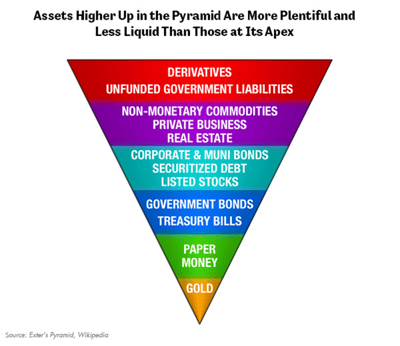
John Exter’s “Inverted Pyramid” is a simple heuristic that describes the pattern of returns that takes place over an economic cycle. When risk taking is on the rise, money flows seeking higher returns “up the pyramid,” shunning the safety of the most creditworthy lower tranches. As the cycle peaks, however, money flees the riskier and more illiquid, less creditworthy investments for the safety of stronger ones. These money flows create the “flight to quality” that can increase the value of longer-dated US Treasury bonds and gold. Both of these investments reside lower in Exter's Pyramid and have increased in price while the equity market higher up the pyramid has declined. In Exter's model, are we watching in real time the peak in risk taking?
While the answer to this question will only be known in retrospect, there are three key indicators we have generally found trustworthy to gauge real-time risk appetite. These provide insight into where we are in the cycle. These three market-based, forward looking indicators are 1.) credit default swaps (CDS,) 2.) interest rate expectations, and 3.) the relative performance of gold.
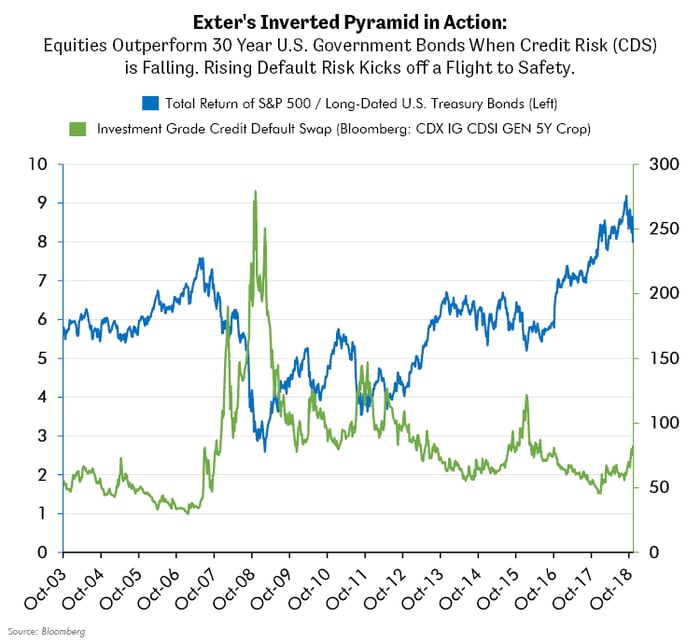
We believe the graph above is strongly suggestive of a deeper truth: that rising CDS can mark the beginning of a turn in risk taking appetite. We believe that this relationship of credit leading equities is causal. The job of CDS is to hedge default risk in bonds. Since bonds are a senior claim to equities in a company’s capital structure, rising problems (rising CDS) in the senior tranche (bonds) should mathematically suggest that problems in the junior tranche (equities) may follow. The credit markets are larger than equity markets and provide the needed flow of financing for commerce to thrive. If confidence in credit is falling – the perception of risk is rising. This could lead to a rising cost of debt and less accommodative debt financing, both of which can lower the fuel that finances a company’s growth.
Certainly, it’s easy to see that CDS turned up eight months before equities peaked in 2007 and peaked three months before equities troughed in early 2009. CDS began rising again in January of this year, about eight months ahead of the eventual peak (so far) in the S&P 500. Accordingly, we think it’s reasonable to watch CDS to inform our views on the best mix of stocks versus bonds as the cycle changes. So, the CDS market is important to our risk management and capital allocation.
Another indicator that we have found useful is illustrated below, showing the relative returns of stocks to longer-dated US Treasuries (also shown in the previous chart) versus the market’s future expectation for short-term interest rates. The interest rate measure we use is the market’s expectation for 90-day interest rates (LIBOR) that will prevail in approximately two and a half years’ time. This measure caught the peaks beautifully in 2000 and again in 2007, and – so far – marked another peak on October 5 of this year, when equities peaked relative to US Treasury bonds.
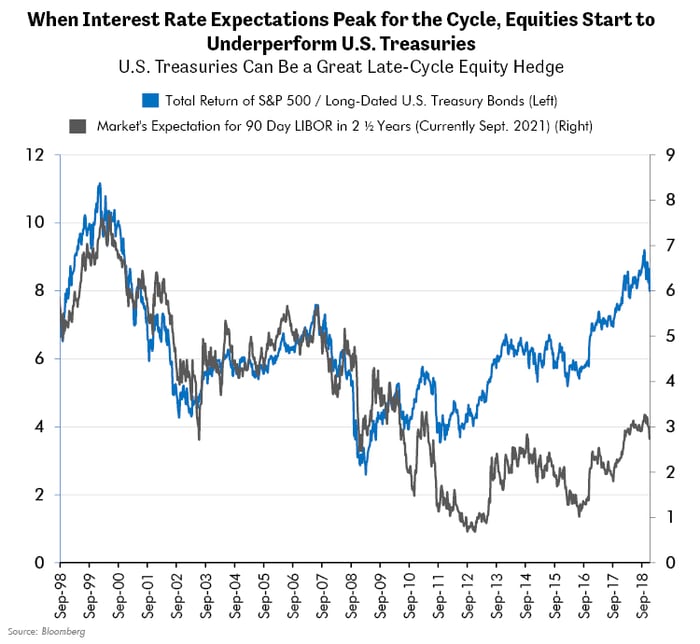
Other measures of the LIBOR market that we monitor (December 2019 relative to December 2018) have all but eliminated any expectation of future Fed interest rate hikes in 2019. The Fed has not changed its commentary, which continues to suggest its preferred path is an additional three interest rate hikes of 25 bps each. But, as we should expect, the market has moved ahead of the Fed.
Many were caught flat-footed by this huge move in market expectations. I find it unsurprising that reports from the Commodity Futures Trading Commission (CFTC) showed near all-time highs in the aggressiveness with which speculators were betting that the price of longer-dated US Treasury bonds would fall. Then came the recent collapse in interest rate expectations, an explosive bond rally, and a fall in equities. In my experience, it is not unusual to see speculative positions be vastly wrong at important cyclical turns. Certainly, they were this time. It seems that short term speculators were too fixated, reacting to the “news” about where the puck was, not where it was going.
Finally, rounding out the last of our most useful indicators for risk taking appetite and asset allocation, is the ratio of the stock market to the gold price. Below we illustrate the ratio of the S&P 500 to the gold price, versus the market’s expectation for short term interest rates in about two and a half years’ time. Note this is the same interest rate expectation that we used in the prior chart.
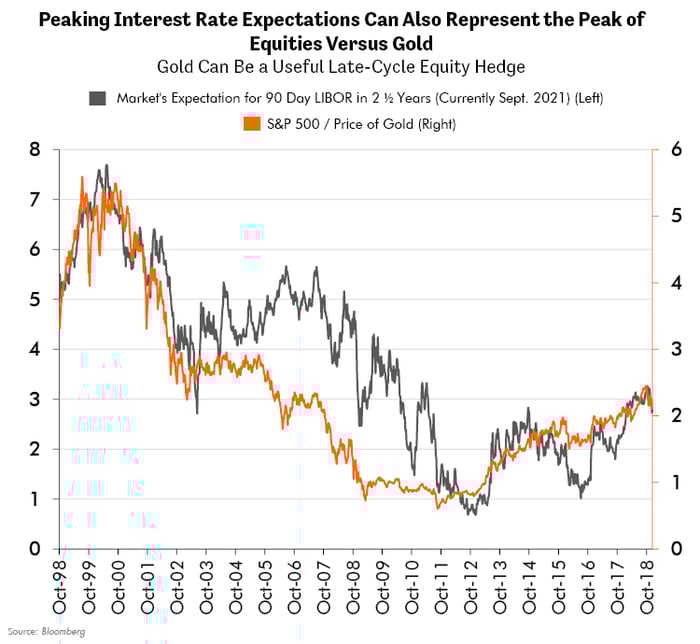
I find it noteworthy that this relationship to gold prices caught the turn beautifully in 2000, called the turn two years in advance in 2005, and peaked (for now) on September 27, just a few days before the market’s interest rate expectations would peak (so far). I do not believe that gold’s relationship to the stock market is causal but do believe that gold’s price action relative to the stock market is a key indicator for risk appetite and movement up and down Exter’s pyramid. Why? Gold – like US Treasury bonds – can be considered a default free asset. This earns gold a spot superior even to US Treasuries in Exter’s pyramid. Accordingly, a chart of the S&P 500 to gold should convey similar insight into risk appetite and investor flows along Exter’s pyramid.
Furthermore, it’s interesting to note that the CFTC’s speculative positioning report shows speculators were, until just a few days ago, aggressively betting against gold prices. Yesterday, my good friend John Bridges, JP Morgan’s highly experienced and insightful gold equity analyst, published a report on gold that contained the chart below.
In it, John illustrates that CFTC data shows aggressively negative speculative positioning betting against gold. In fact, just recently it was the biggest bet against gold in more than ten years! Again, I do not find it ironic that short term speculators, reacting to “news” of where the puck is, would be caught with such lopsided positions at exactly the moment that equities (so far) were peaking, and gold (so far) was bottoming.
.png?width=600&name=JPM%20(possibly%20to%20be%20replaced).png)
“Let the puck do all the moving and you get yourself in the right place. The hardest work is…getting open. The shot is cake.” – Wayne Gretzky
Exter’s inverted pyramid, and how capital flows up and down it, are foundational principles of our portfolio management. We watch credit default swaps, interest rate expectations, and equity prices in gold terms - along with speculative positioning - to inform what we think is the ideal asset allocation. Furthermore, this ideal allocation changes as the cycle changes, and as risk appetite changes. The asset allocations that we believe are more defensive and appropriate for the later innings of the cycle include a meaningful and growing ownership in US Treasury bonds and gold-related investments, which occupy the strongest position in Exter’s pyramid.
We change our asset allocation not based on “news” but rather strive to look ahead, as the market does, to the future – to where the puck is going. Our experienced investment team leverages its fundamental research experience to identify what it believes are the best bottoms up, specific stock and bond ideas that can accomplish this goal.
We agree with Gretzky that the best way to win is to engage the whole team to get to the right place. This team includes readers of “Trends and Tail Risks” too, and we hope it helps you understand the reasoning behind our investment decisions.